The busy spring market has officially kicked off in the La Plata County real estate market. Residential statistics have gained momentum from monthly sales to increased inventory. Tracking these key metrics month-over-month (MoM) and year-over-year (YoY) helps us provide accurate and informed guidance to both buyers and sellers.
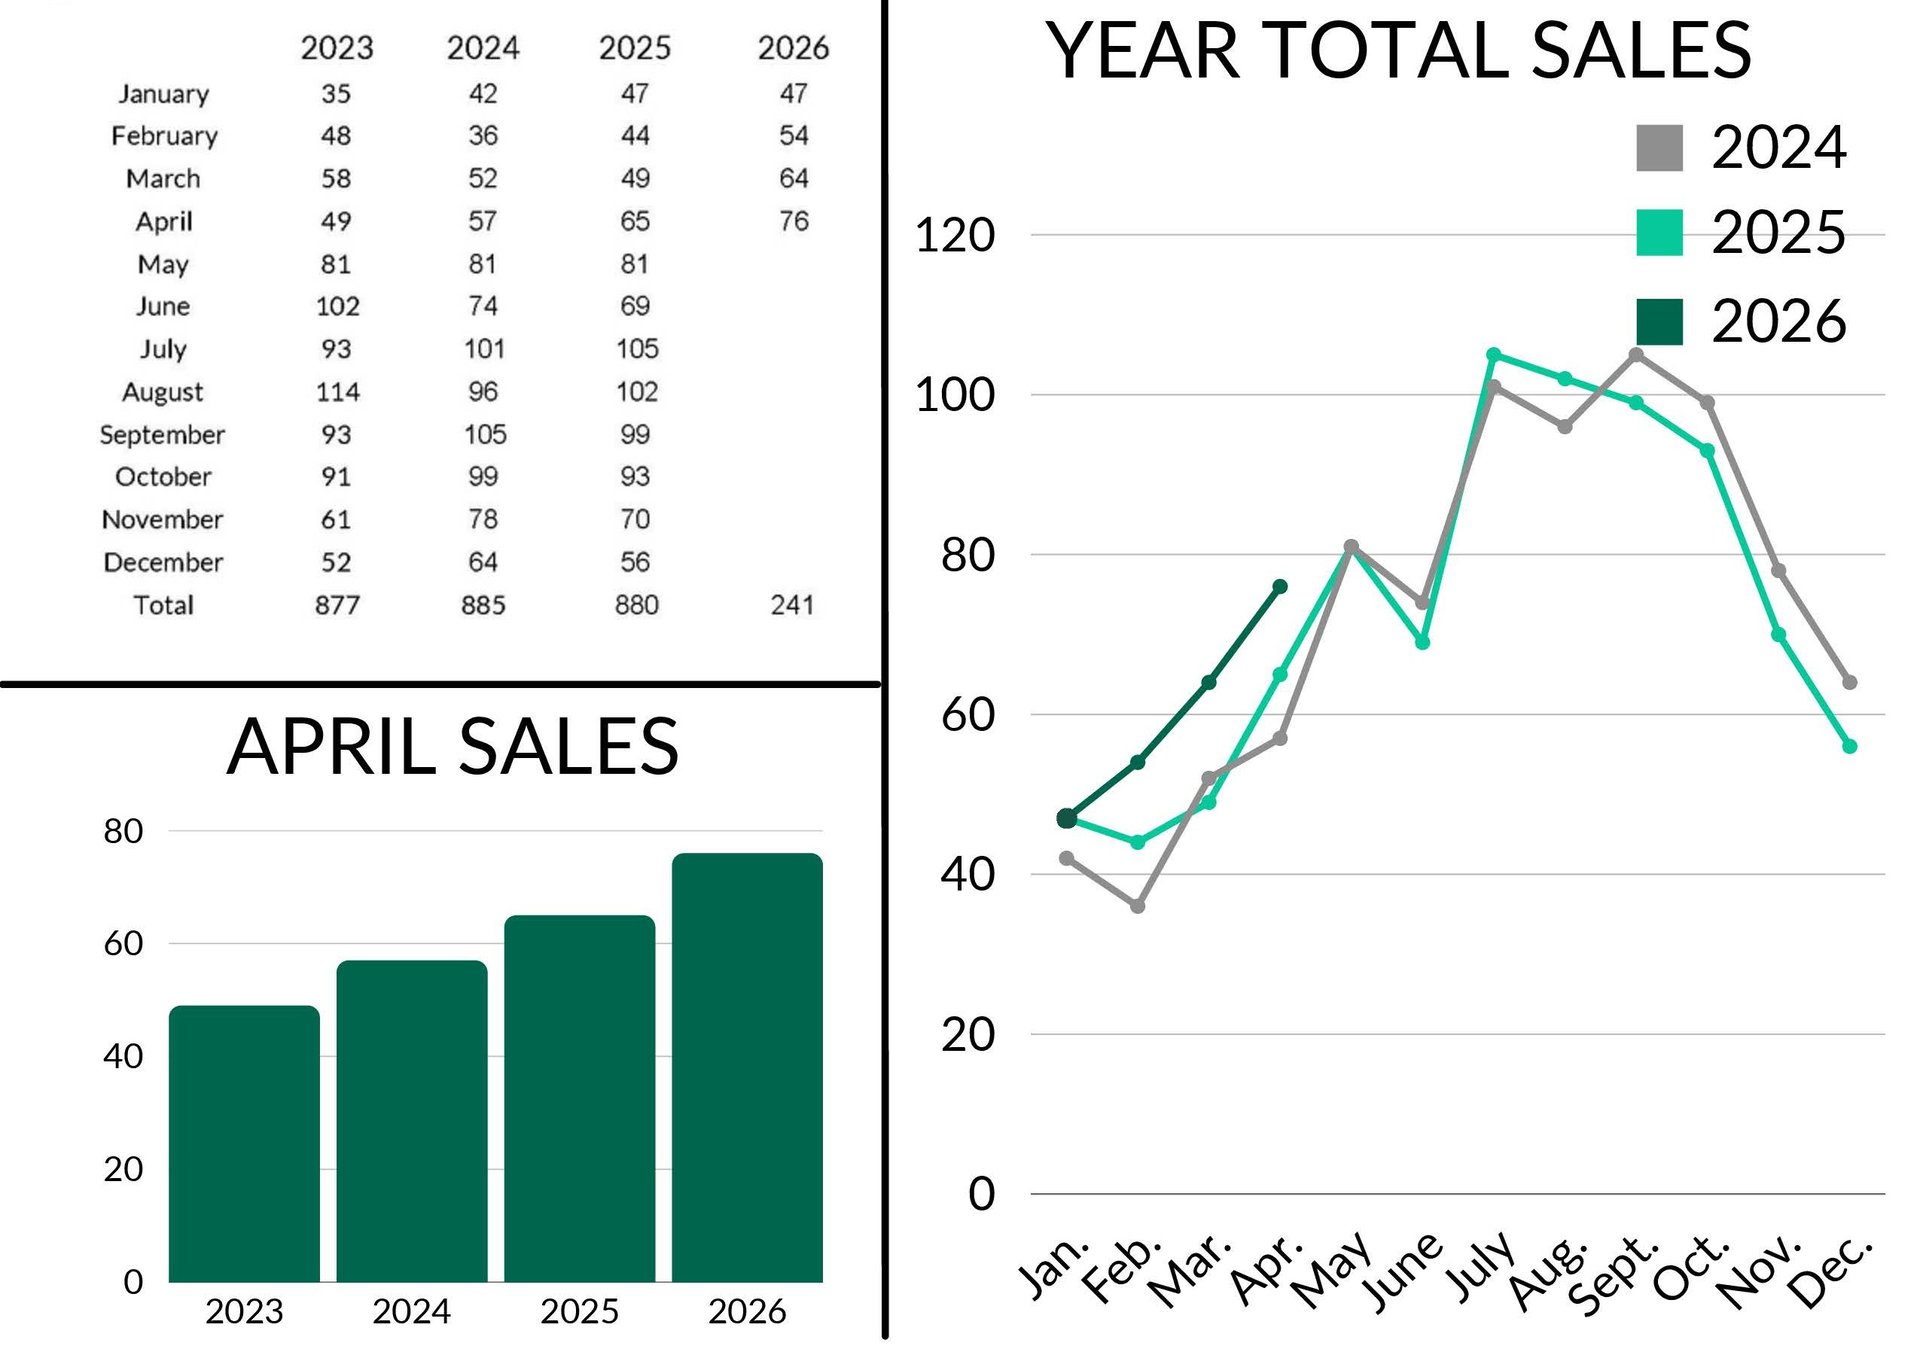
April Sales:
- April 2026 Total Sales: 76
- March 2026: 64 - 🠅 18.75%
- April 2025: 65 - 🠅 16.92%
- Year-to-date (YTD) sales: 241
- 2025: 205 - 🠅 17.56%
- 2024: 187 - 🠅 28.88%
April sales are tracking higher than the last three years, and YTD sales also increased significantly. It is great to see more and more activity and movement in the La Plata County residential real estate market. If we dig deeper and look at the in-town /rural breakdown, about 75% of these sales occurred in the Durango area, of which just over half are in the rural market outside of city limits. April typically sees a boost in sales, so maintaining this trend is a positive metric for our market.
Inventory:
- Active Listings: 426
- March 2026: 352 - 🠅 21.02%
- April 2025: 358 - 🠅 18.99%
- Pending (under contract) Listings: 125
- March 2026: 108 - 🠅 15.74%
- April 2025: 94 - 🠅 32.98%
The local inventory continues to make strides, surpassing 400 listings one month earlier than it did in 2025. If our market keeps trending upward, we are on track to have over 500 homes in inventory, something that has not happened since before the Covid-19 market in 2020. Although more inventory typically benefits buyers more than sellers, it does create a balanced market, allowing buyers more options as well as sellers more opportunities when upsizing or downsizing. MoM and YoY pending sales also increased, which tells us that supply and demand are growing alongside one another, keeping the market active despite the rise in inventory.
Price Trends:
- Average Sales Price: $823,210
- March 2026: $832,454 - 🠇 1.12%
- April 2025: $795,330 - 🠅 3.51%
- Median Sales Price: $695,500
- March 2026: $691,500 - 🠅 0.58%
- April 2025: $650,000 - 🠅 7%
Slight decreases in average and median prices aren’t necessarily a bad thing. As inventory increases and buyers gain more options, we often see price growth beginning to stabilize rather than continue the rapid pace experienced over the last several years. Since these numbers are based on YTD totals, a handful of multimillion-dollar sales in just four months can significantly impact the average and median statistics. As homes continue to sell, including high-end properties, the numbers will more accurately reflect the overall market. The approximately $10,000 decrease in average sale price MoM is not concerning, especially as the YoY figure is still showing a near 4% increase. The median sales price typically is a more accurate representation of the current pricing as it naturally eliminates the outlying high and low sales. Watching this number increase by small increments MoM is positive for our area’s sellers and demonstrates the strength of real estate investment in the Southwest Colorado market.
Time on the Market:
- Average Days on Market: 121 days
- March 2026: 130 - 🠇 9 days
- April 2025: 109 - 🠅 12 days
- Median Days on Market: 90 days
- March 2026: 107 - 🠇 17 days
- April 2025: 78 - 🠅 12 days
Similar to last month, the MoM decrease in average and median days on market represents the market picking up pace, an expected trend for this time of year. However, the YoY days on market are 12 days slower, which can be attributed to the higher inventory as well as prices stabilizing, meaning buyers have more choices and accurate pricing is crucial.
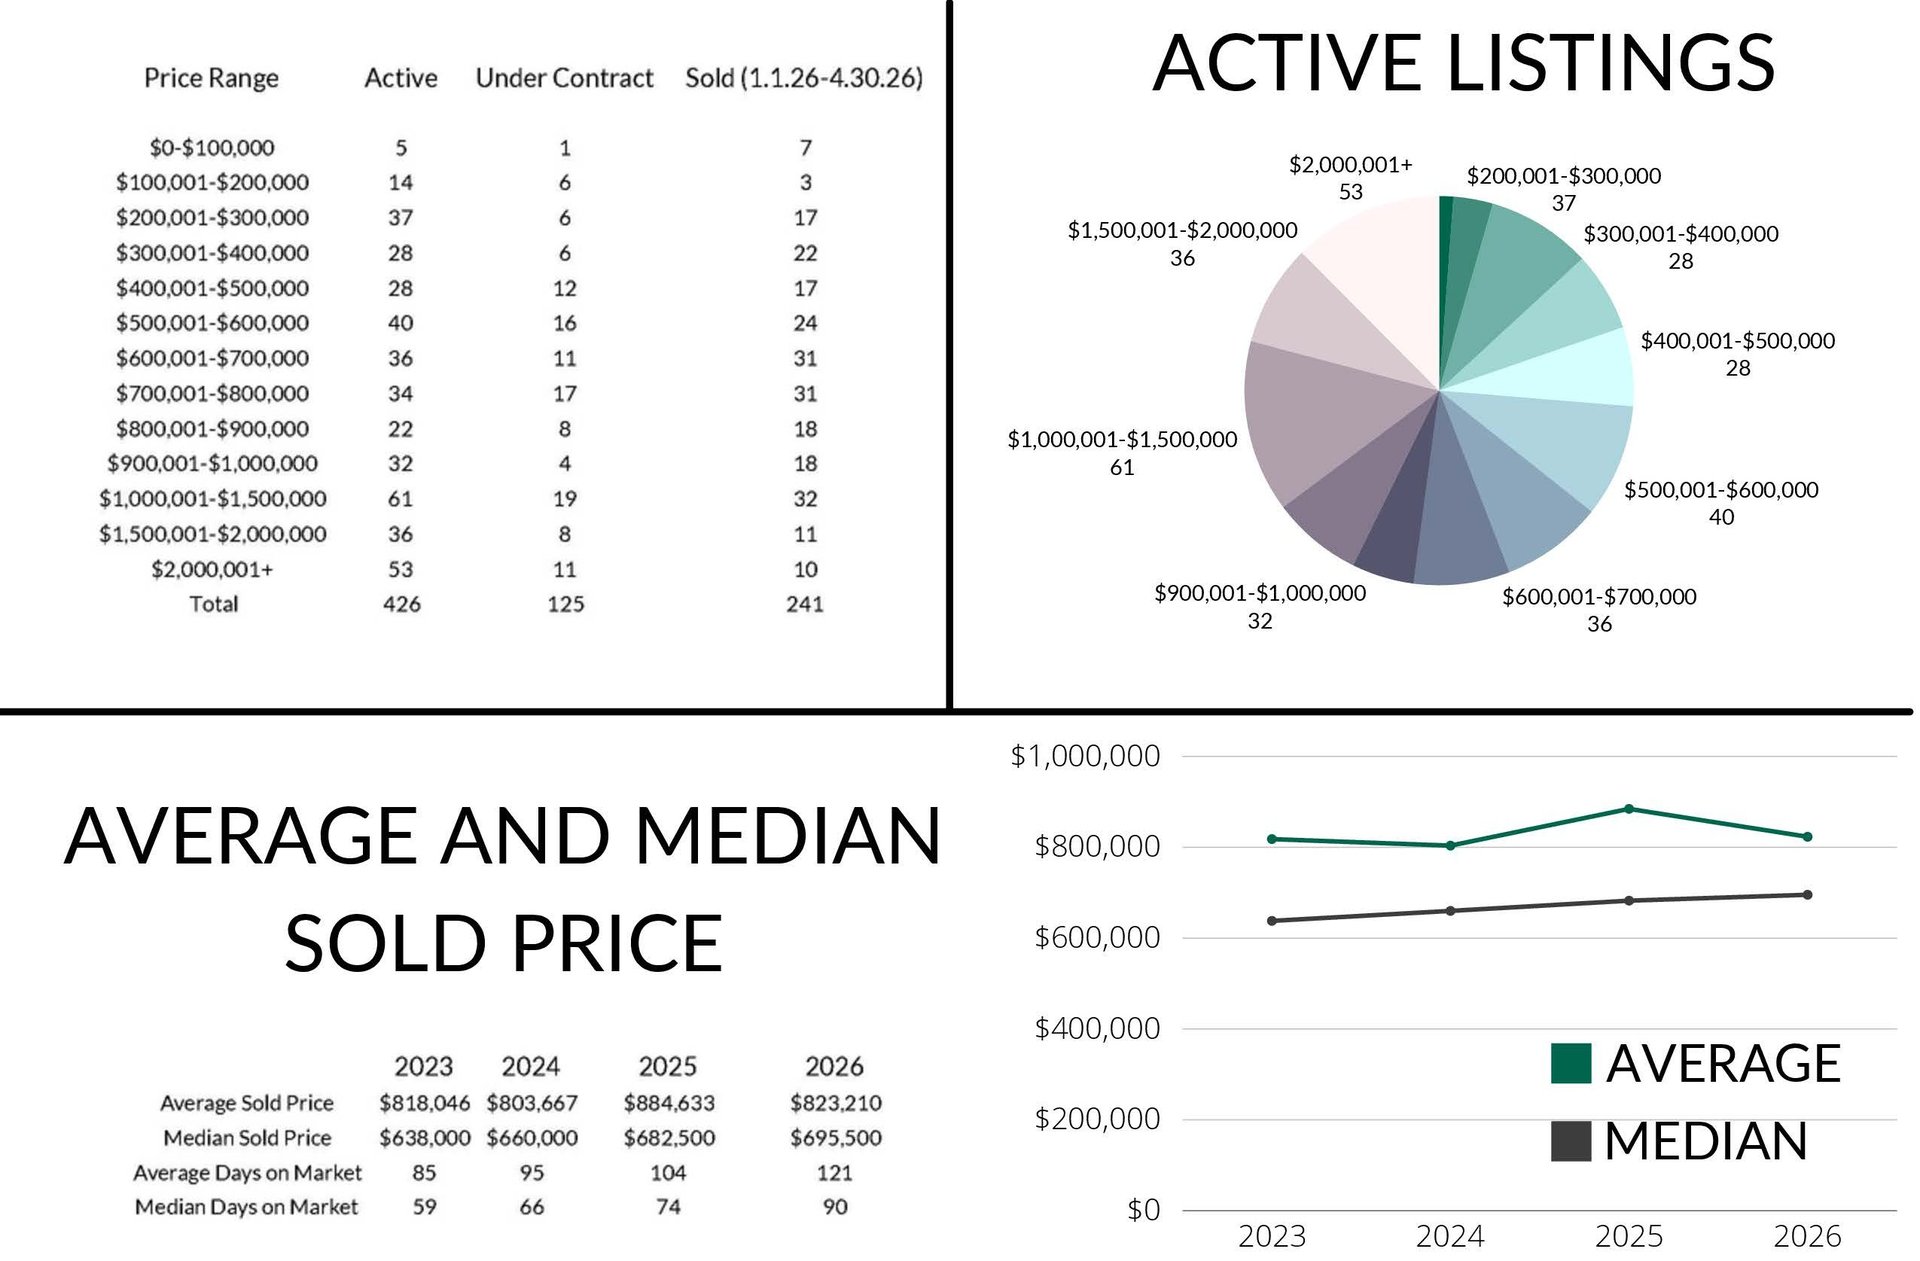
Trending Price Ranges:
- $200,001 - $300,000
- 37 active listings
- $500,001 - $800,000
- 110 active listings
- 44 pending
- 86 sold year-to-date
- $1,000,000+
- 61 active listings between $1,000,001 - $1,500,000
- 36 active listings between $1,500,001 - $2,000,000
- 53 active listings over $2,000,001
- 53 $1,000,000+ listings sold year-to-date
We continue to see about 10% of active listings in the sub-$300,000 range, mainly composed of resort-area condos and mobile homes not attached to the land. The mid-range between $500,001 - $800,000 represents a large portion of the market, with about 25% of active and 35% of sold properties falling into this category. The $1,000,001+ range continues to build inventory with MoM increases in each sub-category, now composing 35% of all actives. Sales within these categories, especially the $1,000,001 - $1,500,000 range, continue to be active in the Durango area market across both in-town and rural properties.
We do typically see a slight slow down in mid-May as people are busy with school getting out and all of the activities surrounding that, but as visitors start coming to the area on and after Memorial Day Weekend, we will quickly be in the busiest time of year for the La Plata County real estate market. Whether you are in the market as a buyer or seller, we would love the opportunity to assist you. Please don’t hesitate to reach out to Max and Deven from The Durango Team at The Wells Group for more information.