August 2025 brought small but consistent increases to the La Plata County residential real estate market. By tracking market statistics month-over-month and year-over-year, we can see the trends shaping our market and help both buyers and sellers make informed decisions.
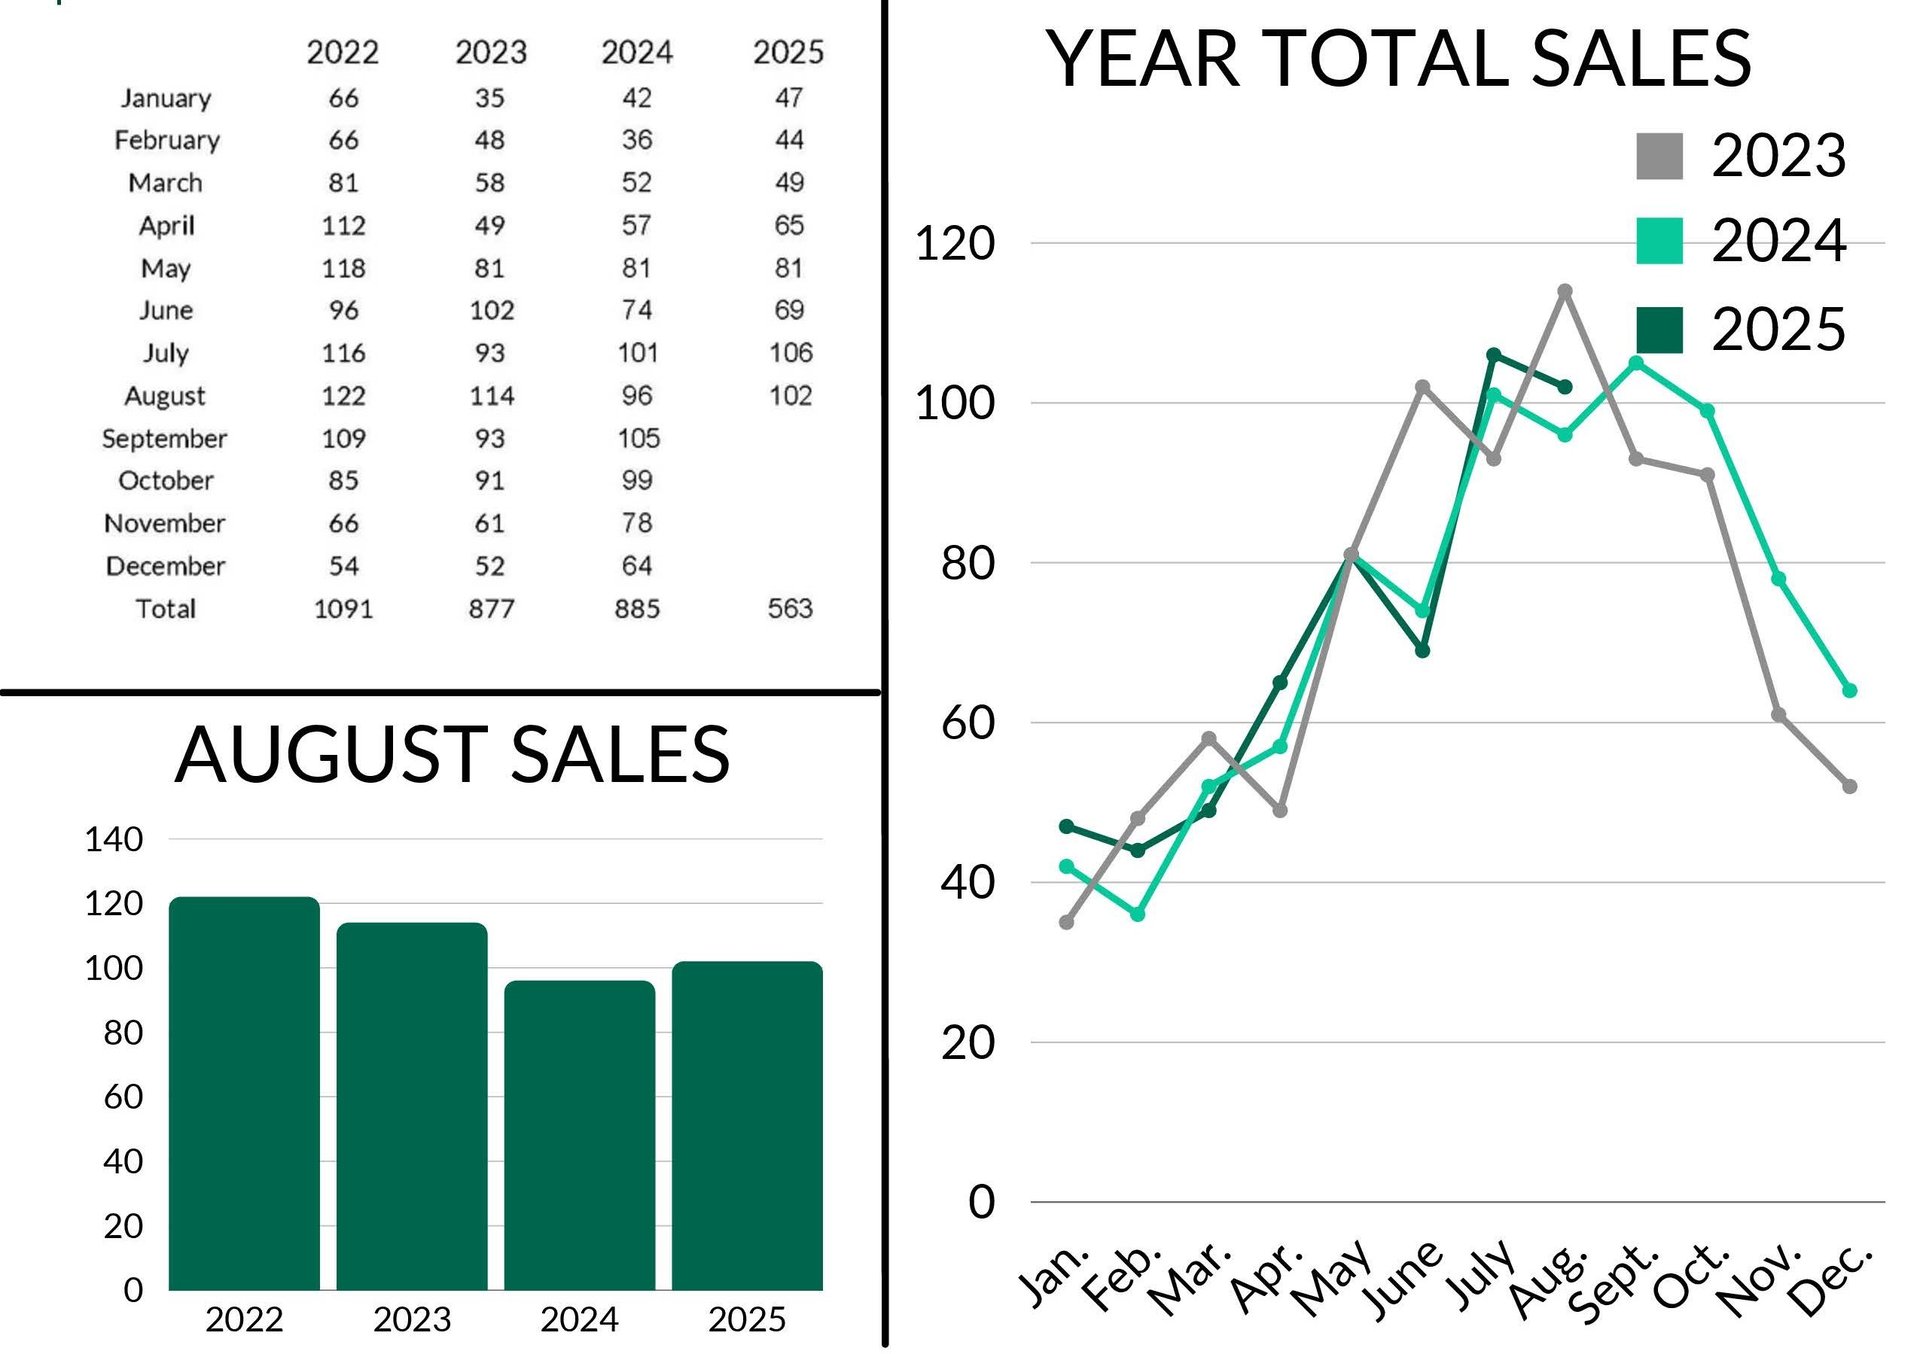
August Sales:
August Total: 102
- Down 4 sales (3.92%) from July 2025
- Up 6 sales (6.25%) year-over-year
Year-to-date sales: 563
- 2024: 539 - up 4.45%
- 2023: 580 - down 3.02%
Even with a slight dip from July, August’s 102 sales reflect a healthy pace. Overall, 2025 continues to outperform 2024, with 24 more sales year-to-date. While totals remain just under 2023’s numbers, we consider this a return to more “normal” activity following the post-pandemic real estate surge.
Price Trends:
Average Sales Price: $873,440
- July 2025: $829,207 - up $44,233
- August 2024: $771,012 - up $102,428
Median Sales Price: $679,000
- July 2025: $686,000 - down $7,000
- August 2024: $640,000 - up $39,000
Year-over-year growth remains strong, with both average and median prices showing steady appreciation. While the median dipped slightly from July 2025, the overall trend continues upward.
Time on the Market:
Average Days on Market: 95 days
- 1 day longer (1.06%) month-over-month
- 5 days longer (5.56%) year-over-year
Median Days on Market: 68 days
- 3 days longer (4.62%) month-over-month
- 8 days longer (13.34%) year-over-year
Homes are taking slightly longer to sell in our current market, however, looking back prior to 2020,120+ average days and 80+ median days on market were common. This demonstrates that the market is continuing to balance between sellers and buyers, compared to the strong seller’s market we’ve been experiencing in the last 4 years.
Inventory:
Active Listings: 460
- July 2025: 469 - down 9
- August 2024: 375 - up 85
- August 2023: 295 - up 165
Pending (under contract) Listings: 131
- July 2025: 136 - down 5
- August 2024: 134 - down 3
- August 2023: 128 - up 3
Even with the slight 1.96% decrease month-over-month, inventory is still 22.67% higher than August 2024 and 55.93% higher than August 2023. This growth also contributes to the shift from a seller-driven market to a more even, balanced market.
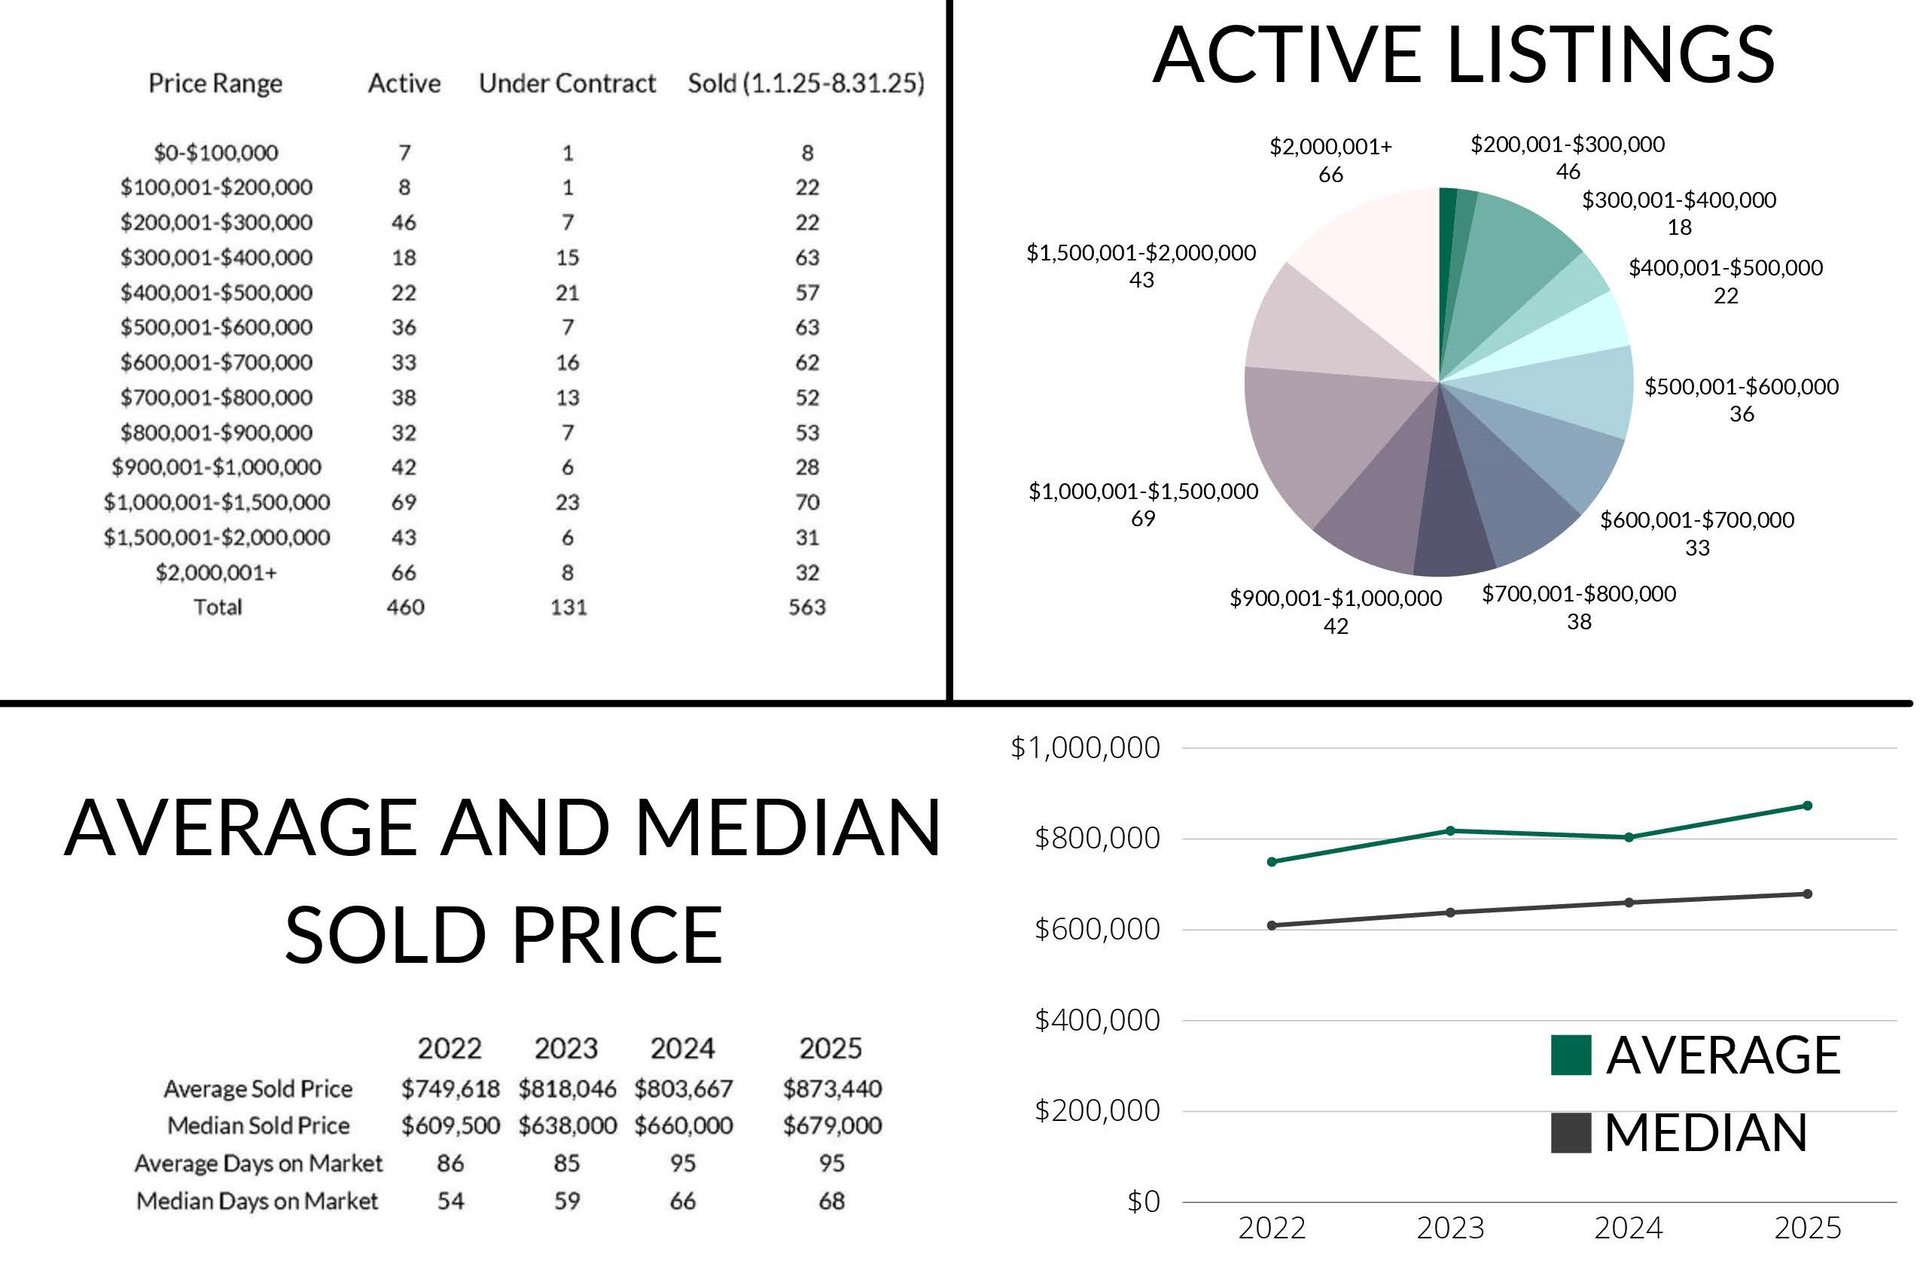
Trending Price Ranges:
$1,000,000+
- 69 active listings between $1,000,001 - $1,500,000
- 43 active listings between $1,500,001 - $2,000,000
- 66 active listings $2,000,001+
- 70 sold listings between $1,000,001 - $1,500,000
$200,001 - $400,000
- 64 active listings
$400,001 - $600,000
- 58 active listings
$600,001 - $800,000
- 71 sold listings
$800,001 - $1,00,000
- 74 sold listings
This summer we’ve seen a large growth in $300,001 - $900,000 sales due to increased inventory, reflecting expanded opportunities, especially first-time buyers. $1,000,001+ remains the most popular price range, accounting for 38.7% of active and 23.62% of sold listings. Pending contracts mirror these trends, with strong activity in both the $1,000,001 - $1,500,000 and $300,001 - $500,000 ranges. We are looking forward to the seeing what the Q4 2025 has in store for the market. After several years of 7%+ interest rates, they are starting to come down. This week they are hovering around 6.3%. Lower interest rates will certainly help affordability for buyers and which will ultimately help sellers as well.
As summer winds down, we expect to see continued activity through September and moving into October, before the normal slow down that typically occurs in the winter months. La Plata County’s diverse property types mean every market segment behaves a little differently, so it is important to consider more than just the numbers. For personalized insights on buying or selling in Southwest Colorado, please don’t hesitate to contact Max and Deven of The Durango Team at The Wells Group.