The La Plata County residential real estate market saw a significant change in activity last month. We track key data points for our market month-over-month (MoM) and year-over-year (YoY) to determine trends, seasonal changes, and when those differ from expected. Metrics that provide an overall look into the market include inventory, number of sales, sales prices, and days on market.
August Sales:
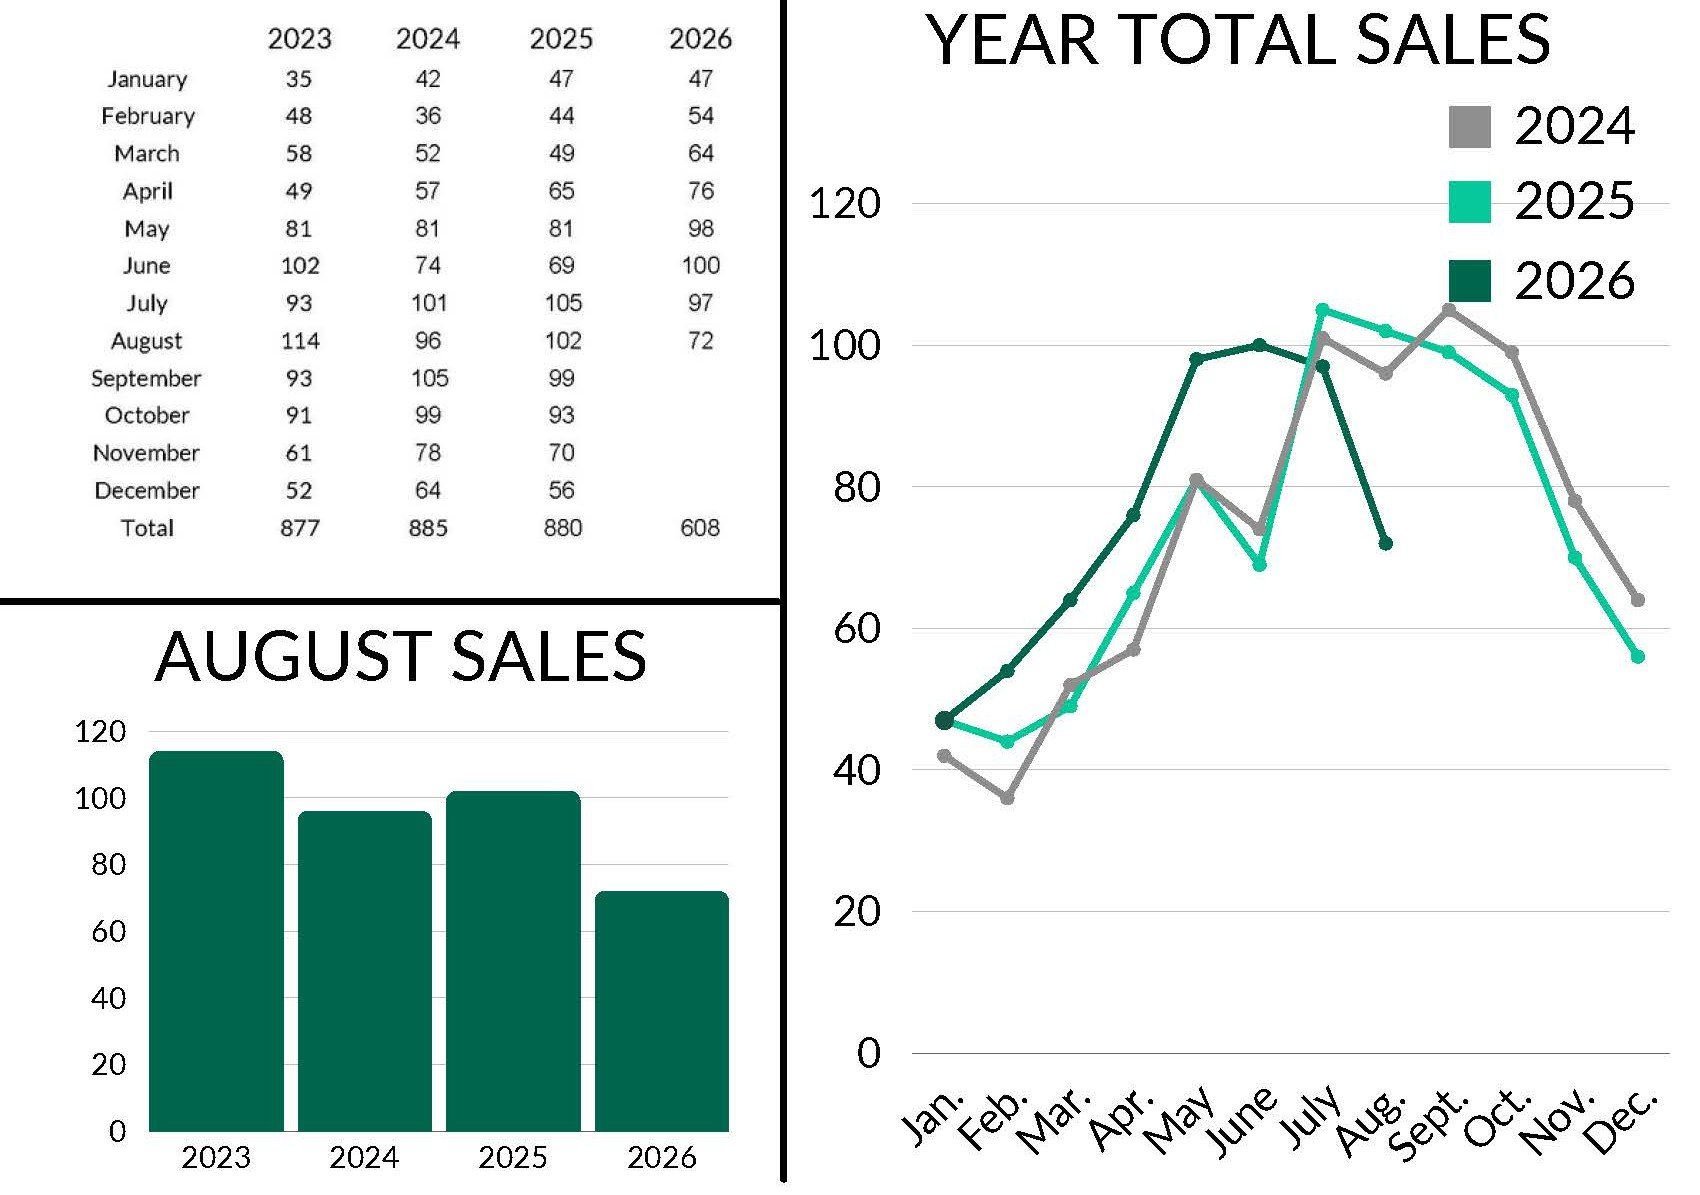
August 2026 Total Sales: 72
July 2026: 97 - 🠇 27.17%
August 2025: 102 - 🠇 29.41%
Year-to-date (YTD) sales: 608
2025: 563 - 🠅 7.99%
2024: 539 - 🠅 12.8%
After slightly fewer sales MoM in July, we expected August to exceed July’s sales; instead, they decreased by 25 homes MoM and 30 YoY. While this is surprising due to the increase in inventory, there are multiple outside market factors that come into play - both which we’ll discuss further below. The year-to-date sales are still elevated from 2024 and 2025 because we had equal or greater activity YoY each month for the first six months of the year. 2024 and 2025 had decreased sales numbers because low inventory meant more sales simply weren’t possible.
Inventory:
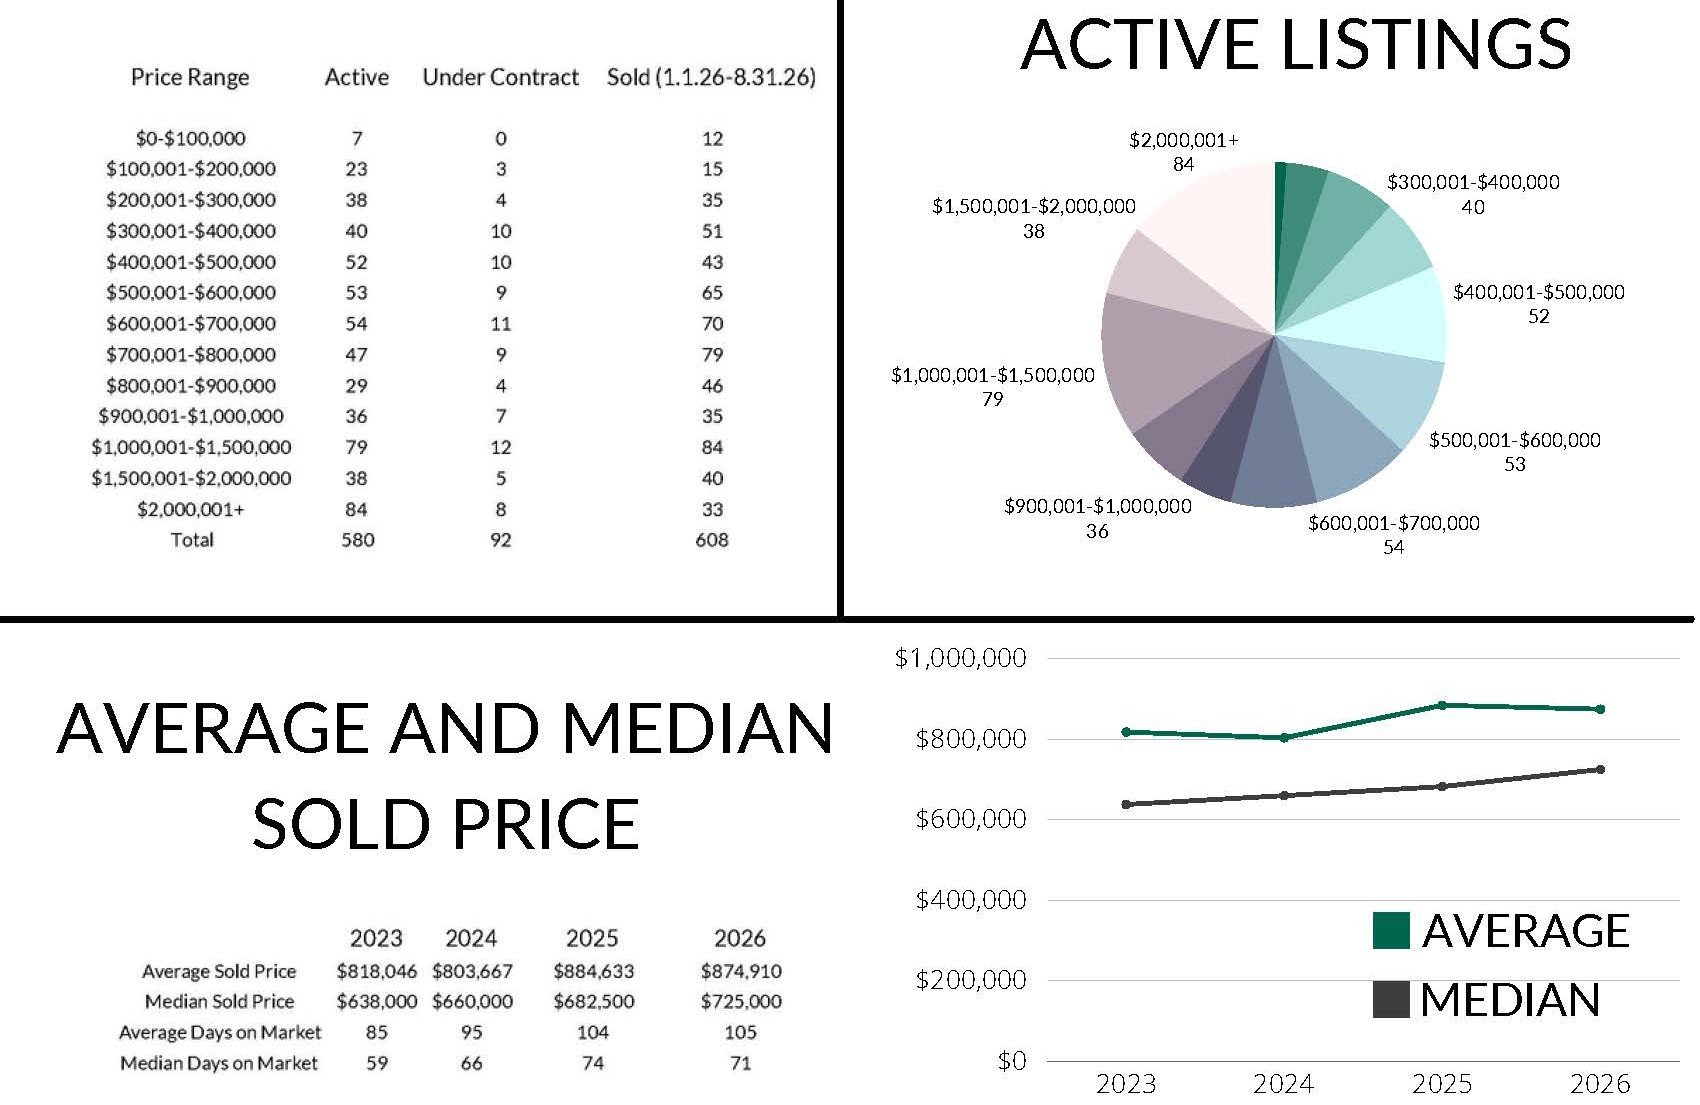
Active Listings: 580
July 2026: 555 - 🠅 4.5%
August 2025: 563 - 🠅 3.02%
Pending (under contract) Listings: 92
July 2026: 96 - 🠇 4.17%
August 2025: 131 - 🠇 29.77%
While we still believe this regrowth in active listings is a healthy market movement, we understand the current frustrations for both buyers and sellers. A heightened inventory benefits buyers as the rules of supply and demand come into play, leading to more competition and lower prices. For sellers it is bringing more buyers into the market, as a lot of buyers were getting frustrated with the low inventory and bidding wars. High interest rates are one major outside factor affecting both buyers and sellers. Rates were near 6% at the beginning of the year; this is why we believe the first and second quarter numbers will end up being stronger than the third and fourth quarters this year. Currently, interest rates are at about 7% and they seem to keep going up. We will be watching this trend closely as we enter the fall and winter market.
Although it’s typical for homes to appreciate annually, prices increased significantly and at a very quick rate from 2021 to 2023. The market appears to be correcting, and we believe it will be level as appreciation goes for a bit longer. We have been struggling with higher interest rates now for two years, and have been saying the same things. It is significantly impacting buyers purchasing power and also keeping home owners from selling. Being locked into a 2% or 3% interest rate makes it really hard to sell and move up to a 7% rate. Let’s remember, sellers become buyers eventually. This has resulted in a decrease in pending listings MoM and YoY.
Price Trends:
Average Sales Price: $874,910
July 2026: $867,522 - 🠅 0.85%
August 2025: $873,440 - 🠅 0.17%
Median Sales Price: $725,000
July 2026: $719,500 - 🠅 0.76%
August 2025: $679,000 - 🠅 6.77%
Despite fewer sales MoM, both the average and median sales price have risen nearly one percent. This is reflected in the trending price ranges (broken down more below) which show nearly one third of last month’s sales for over one million. There does continue to be activity in the lower price ranges, especially as we see more price reductions and look into other areas of La Plata County such as Bayfield and Ignacio. The 6.77% increase YoY in median price is significant and shows this continued influx in worth for our area’s real estate.
Time on the Market:
Average Days on Market: 105 days
July 2026: 106 - 🠇 1 days
August 2025: 95 - 🠅 10 days
Median Days on Market: 71 days
July 2026: 71 - no change
August 2025: 68 - 🠅 3 days
Even though the quantity of sales have decreased MoM, time on market is nearly identical with some increase YoY. The market is moving slower than normal lately, and may continue without mortgage rates changing much. We are anticipating this average days on the market to continue to increase through the end of the year. Although homes are taking longer to sell than recent years, there is still demand for La Plata County real estate and accurate, current, and competitive pricing is imperative.
Trending Price Ranges:
$200,001 - $400,000
78 active listings
13 pending
86 sold YTD
$400,001 - $800,000
206 active listings
39 pending
257 sold YTD
$1,000,000+
79 active listings between $1,000,001 - $1,500,000
38 active listings between $1,500,001 - $2,000,000
81 active listings over $2,000,001
25 $1,000,000+ pending listings
157 $1,000,000+ listings sold year-to-date
With inventory growing just 4.5% MoM and pending listings down slightly, we see similar price changes as to last month’s review. About 33% of all active listings are priced over $1,000,001 with another third between $400,001 - $800,000 which is represented in the median sales price. Notably, 25 homes sold over $1,000,001 last month, making up about 33% of August’s sales. The $1,000,001 - $1,500,000 and $1,500,001 - $2,000,000 showed the most growth MoM as well. These higher-end sales are much less affected by outside factors such as rising interest rates as lately this sector of the market has been 50%+ cash buyers.
As always, there are many local and national factors that affect our Southwest Colorado market. Between political climate, mortgage rates, insurance, the impact of natural disasters, and much more - we stay informed and help our client navigate the everchanging market to the best of our ability. For more information on buying or selling Durango real estate, please contact The Durango Team at The Wells Group.