The La Plata County real estate market is undoubtedly influenced by factors such as mortgage rates, weather, and national economic trends, and this February was no different. It is a historically slower month due to winter conditions. Below, we reflect on the first two months of 2025 and how they compare to past trends.
February Sales:
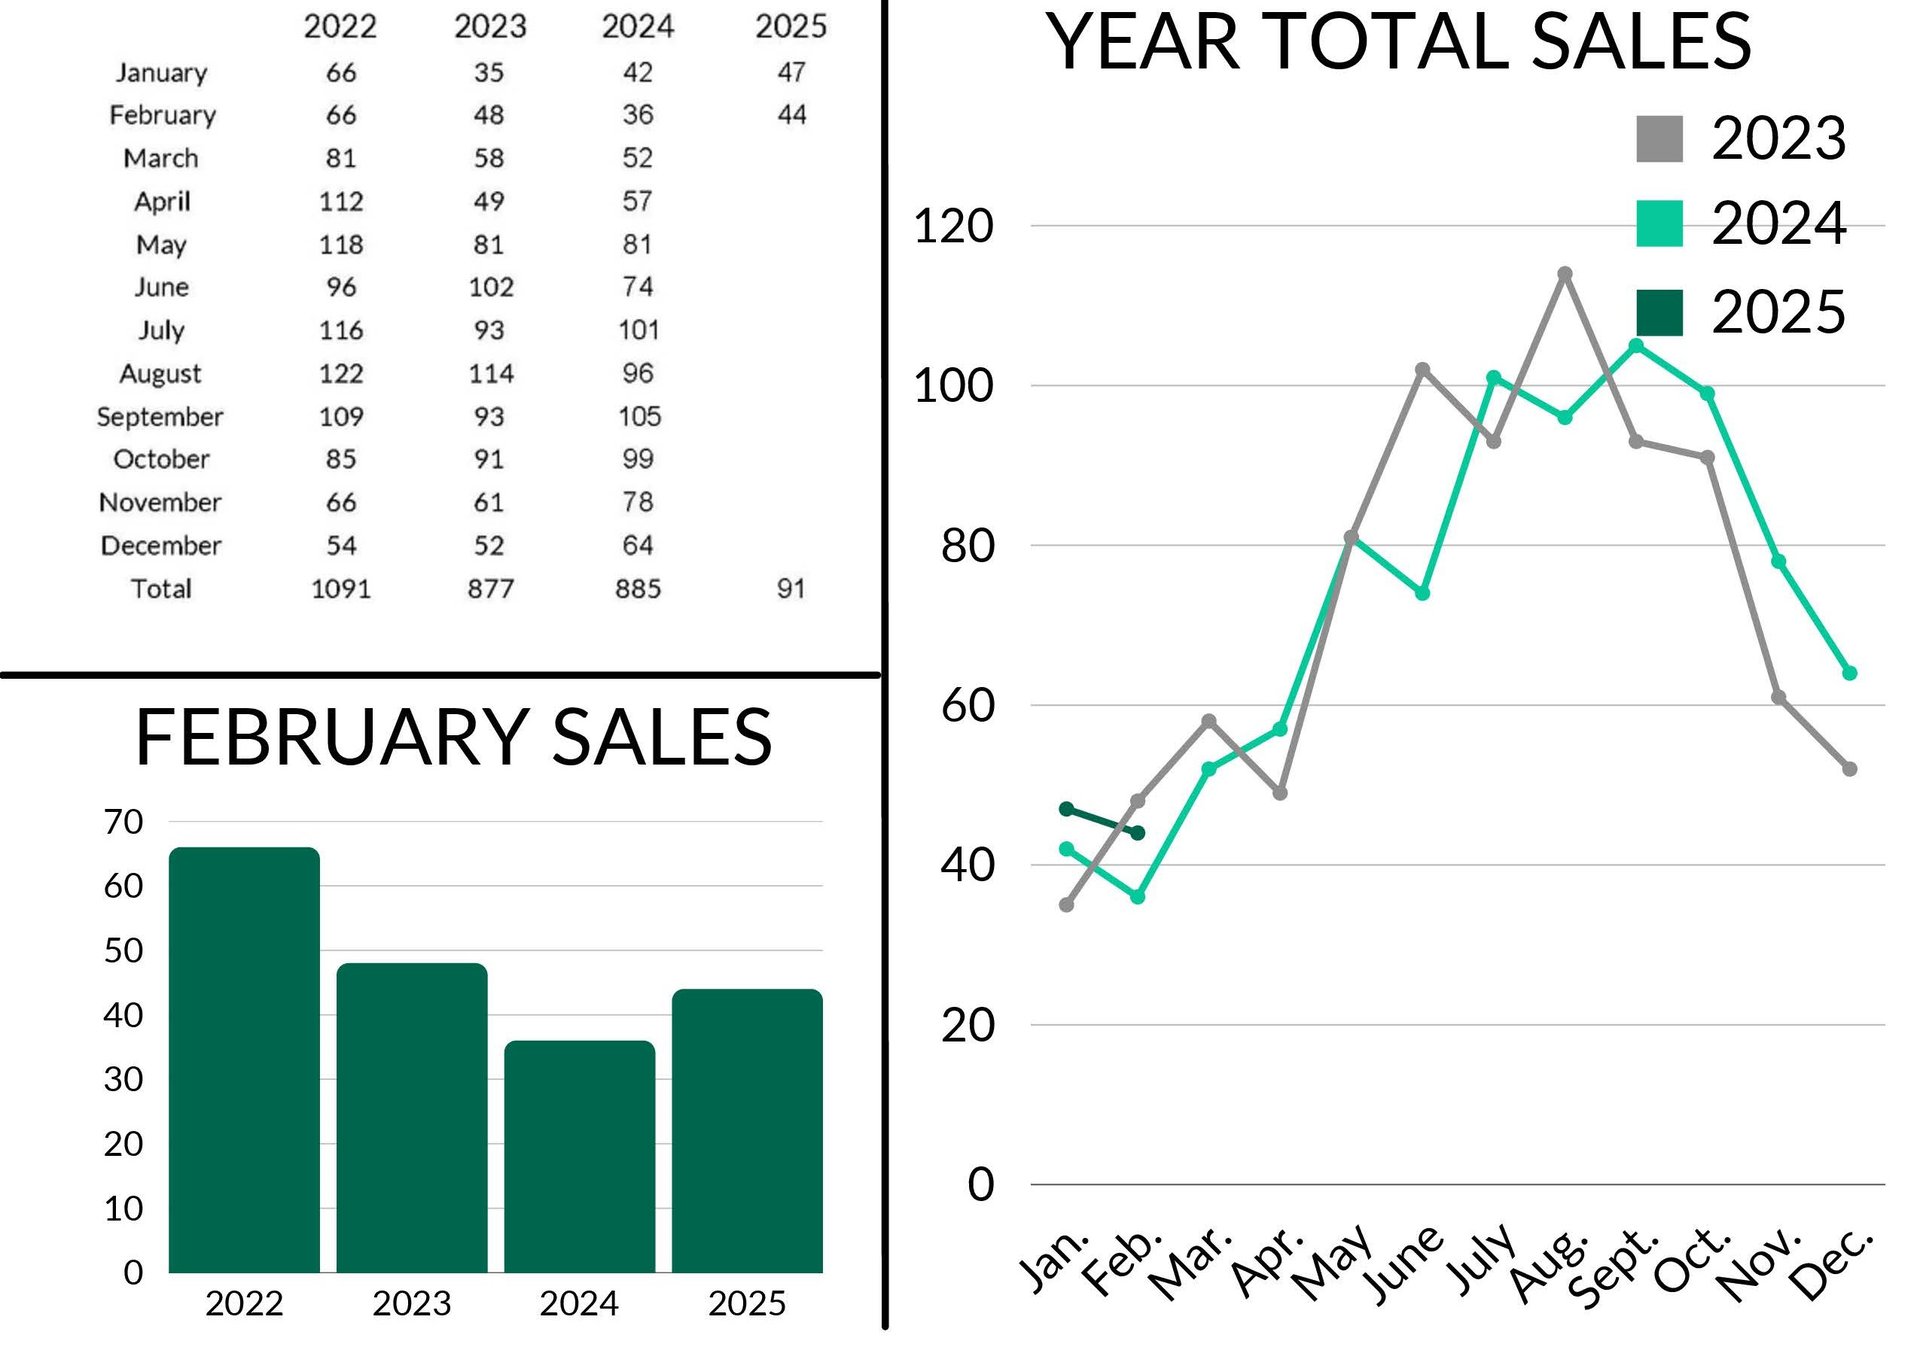
February total: 44
- Up 22.2% year-over-year
- Just three fewer sales less than January 2025
Year-to-date sales: 91
With just two months behind us, 2025 is shaping up to be a busier market than 2024, both on a monthly and year-to-date basis.
Inventory:
Active listings: 251
- Up 3.72% from December 2024
- 24.26% higher year-over-year
Pending (under contract) listings: 72
- 24.14% more than December 2024
- 12.5% fewer than January 2025
There was a surprising amount of activity in January this year, and we attribute part of it to milder winter conditions, making home showings and moves easier.
This steady increase in inventory is a great way to start the year. Over the past 5+ years, early-year inventory levels historically hovered around 500, with summer peaks reaching 700+. However, inventory plummeted in 2020 and has yet to return to pre-pandemic levels. Instead of 400s, those are now the new summer highs.
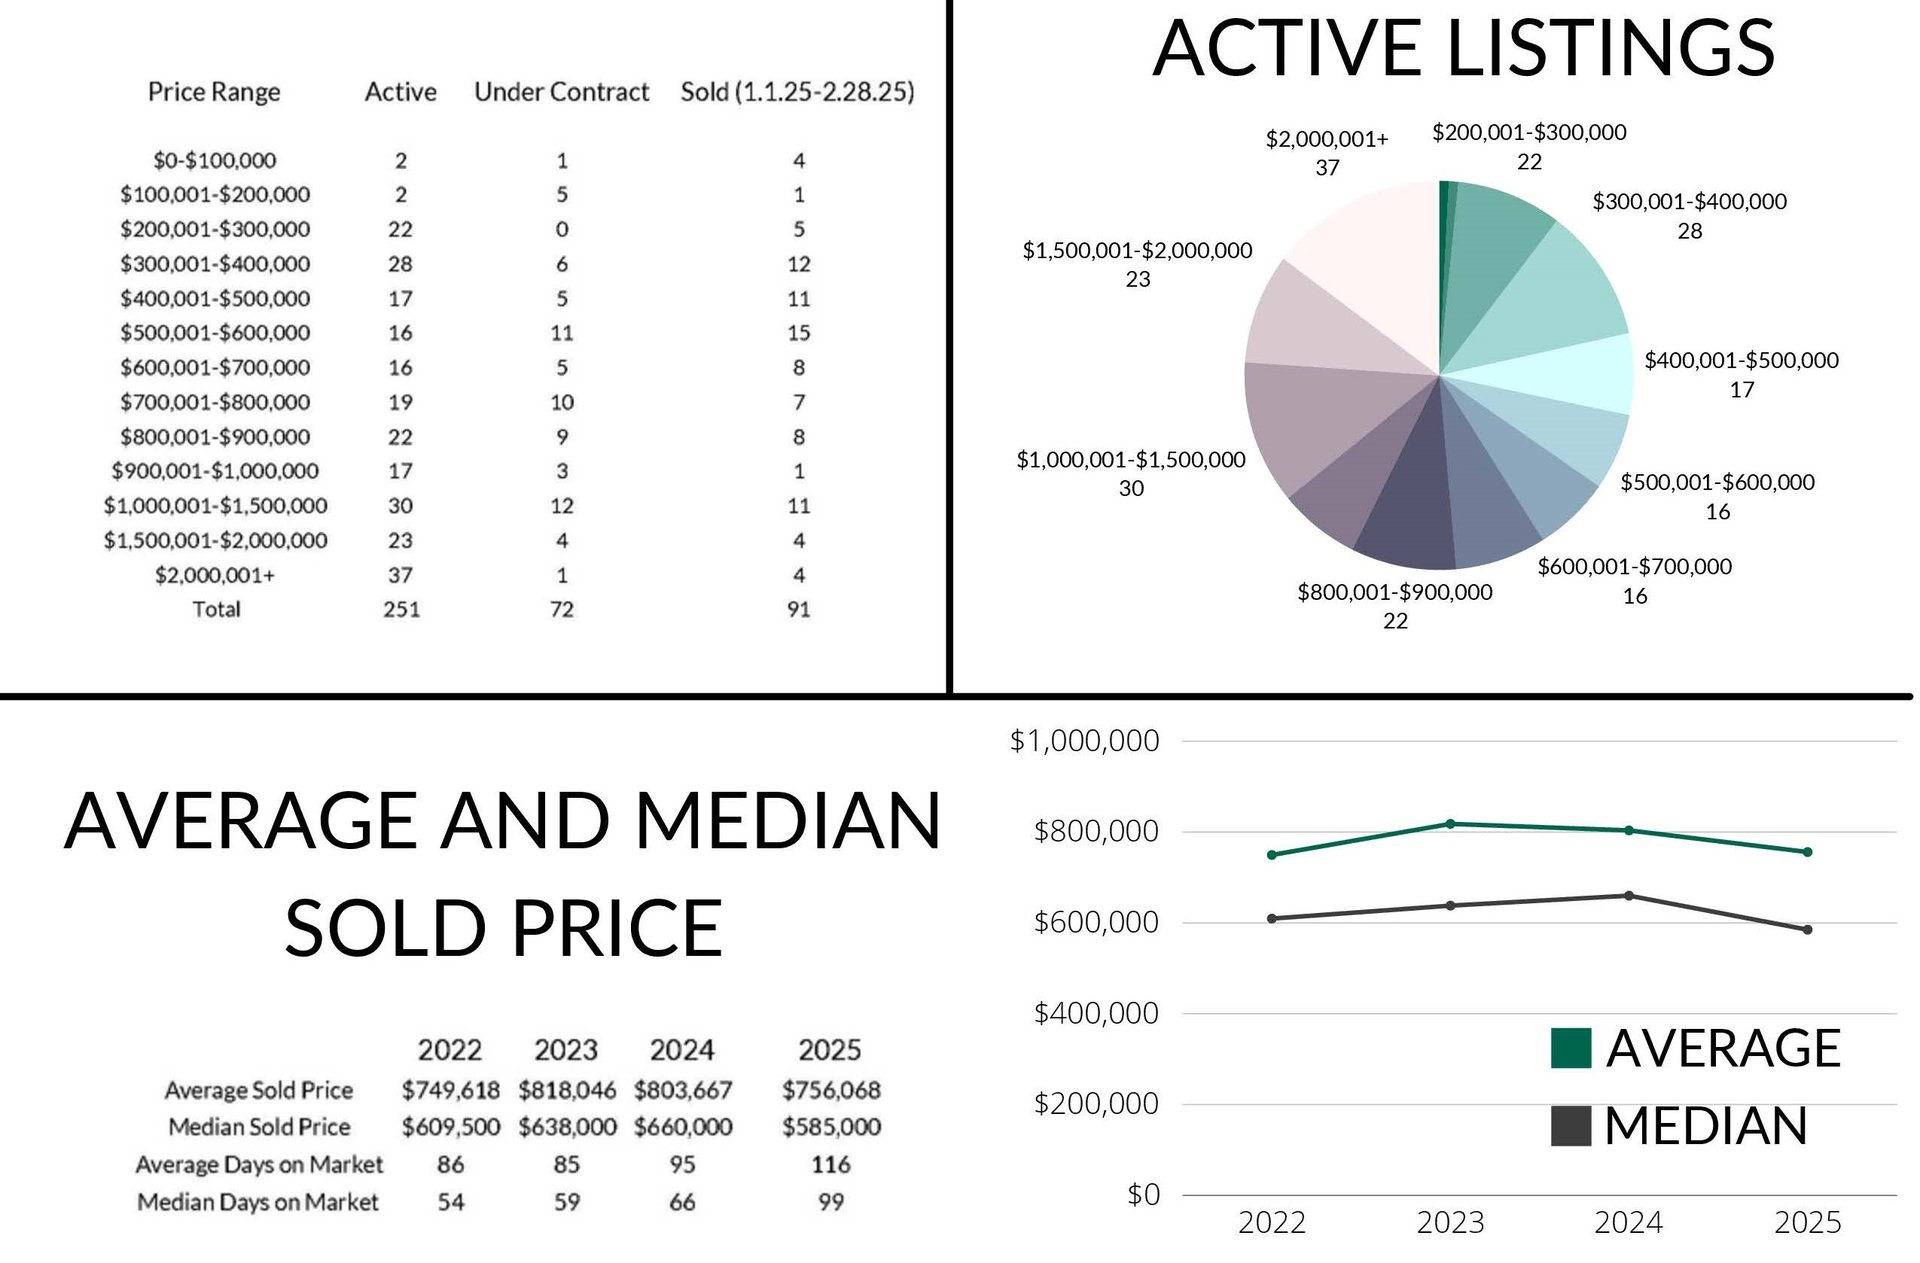
Trending Price Ranges:
$1,000,000+
- 30 active listings between $1,000,001 - $1,500,000
- 23 active listings between $1,500,001 - $2,000,000
- 37 active listings over $2,000,001
- Over 35% of the active market is in the luxury segment
- These segments continue to remain top performers for pendings (23.6%) and closed sales (20.9%)
$500,001 - $600,000
- The most popular pending category last month, with 10 of those now closed
$300,001 - $400,000
- The most common active price range, with 28 listings
$200,001 - $300,000 and $700,001 - $800,000
- Tied for second, each with 22 listings
While average and median prices are currently holding steady, or even under 2024’s, the luxury market ($1,000,001+) remains strong, particularly in active listings. As more of these high-end listings sell, we expect to see this reflected in the average and median sales prices.
Price Trends:
Average Sales Price: $756,068
- Down $60,000 less than January 2025
- $60,000 higher year-over-year
Median Sales Price: $585,000
- Down $50,000 month-over-month
- Up $15,000 year-over-year
Typically, the average price is higher due to a few very high-end sales, while the median price provides a clearer market-wide perspective, eliminating extremes on either end. The $15,000 increase in median price reflects a 2.6% gain, indicating healthy growth in the market. As we move into the busy season, we anticipate further increases.
Time on the Market:
Average Days on Market: 116 days
- Only one day longer than January 2025
- Five days fast year-over-year
Median Days on Market: 99 days
- One day quicker month-over-month
- Ten days quicker year-over-year
As we move through 2025, inventory fluctuations and external market conditions will continue to create a dynamic landscape. Having a full-time real estate professional by your side can make all the difference. For expert guidance, please reach out to Max Hutcheson and Deven Meininger, we’d be honored to assist with your real estate needs.