With the first month of the year complete, we can observe market trends beginning to unfold. By tracking key statistics every month, we can evaluate month-over-month (MoM) and year-over-year (YoY) changes to better understand where our market is headed and provide our clients with timely and accurate information. In the La Plata County residential market, we look at inventory, sales activity, prices, and other factors to provide meaningful insight.
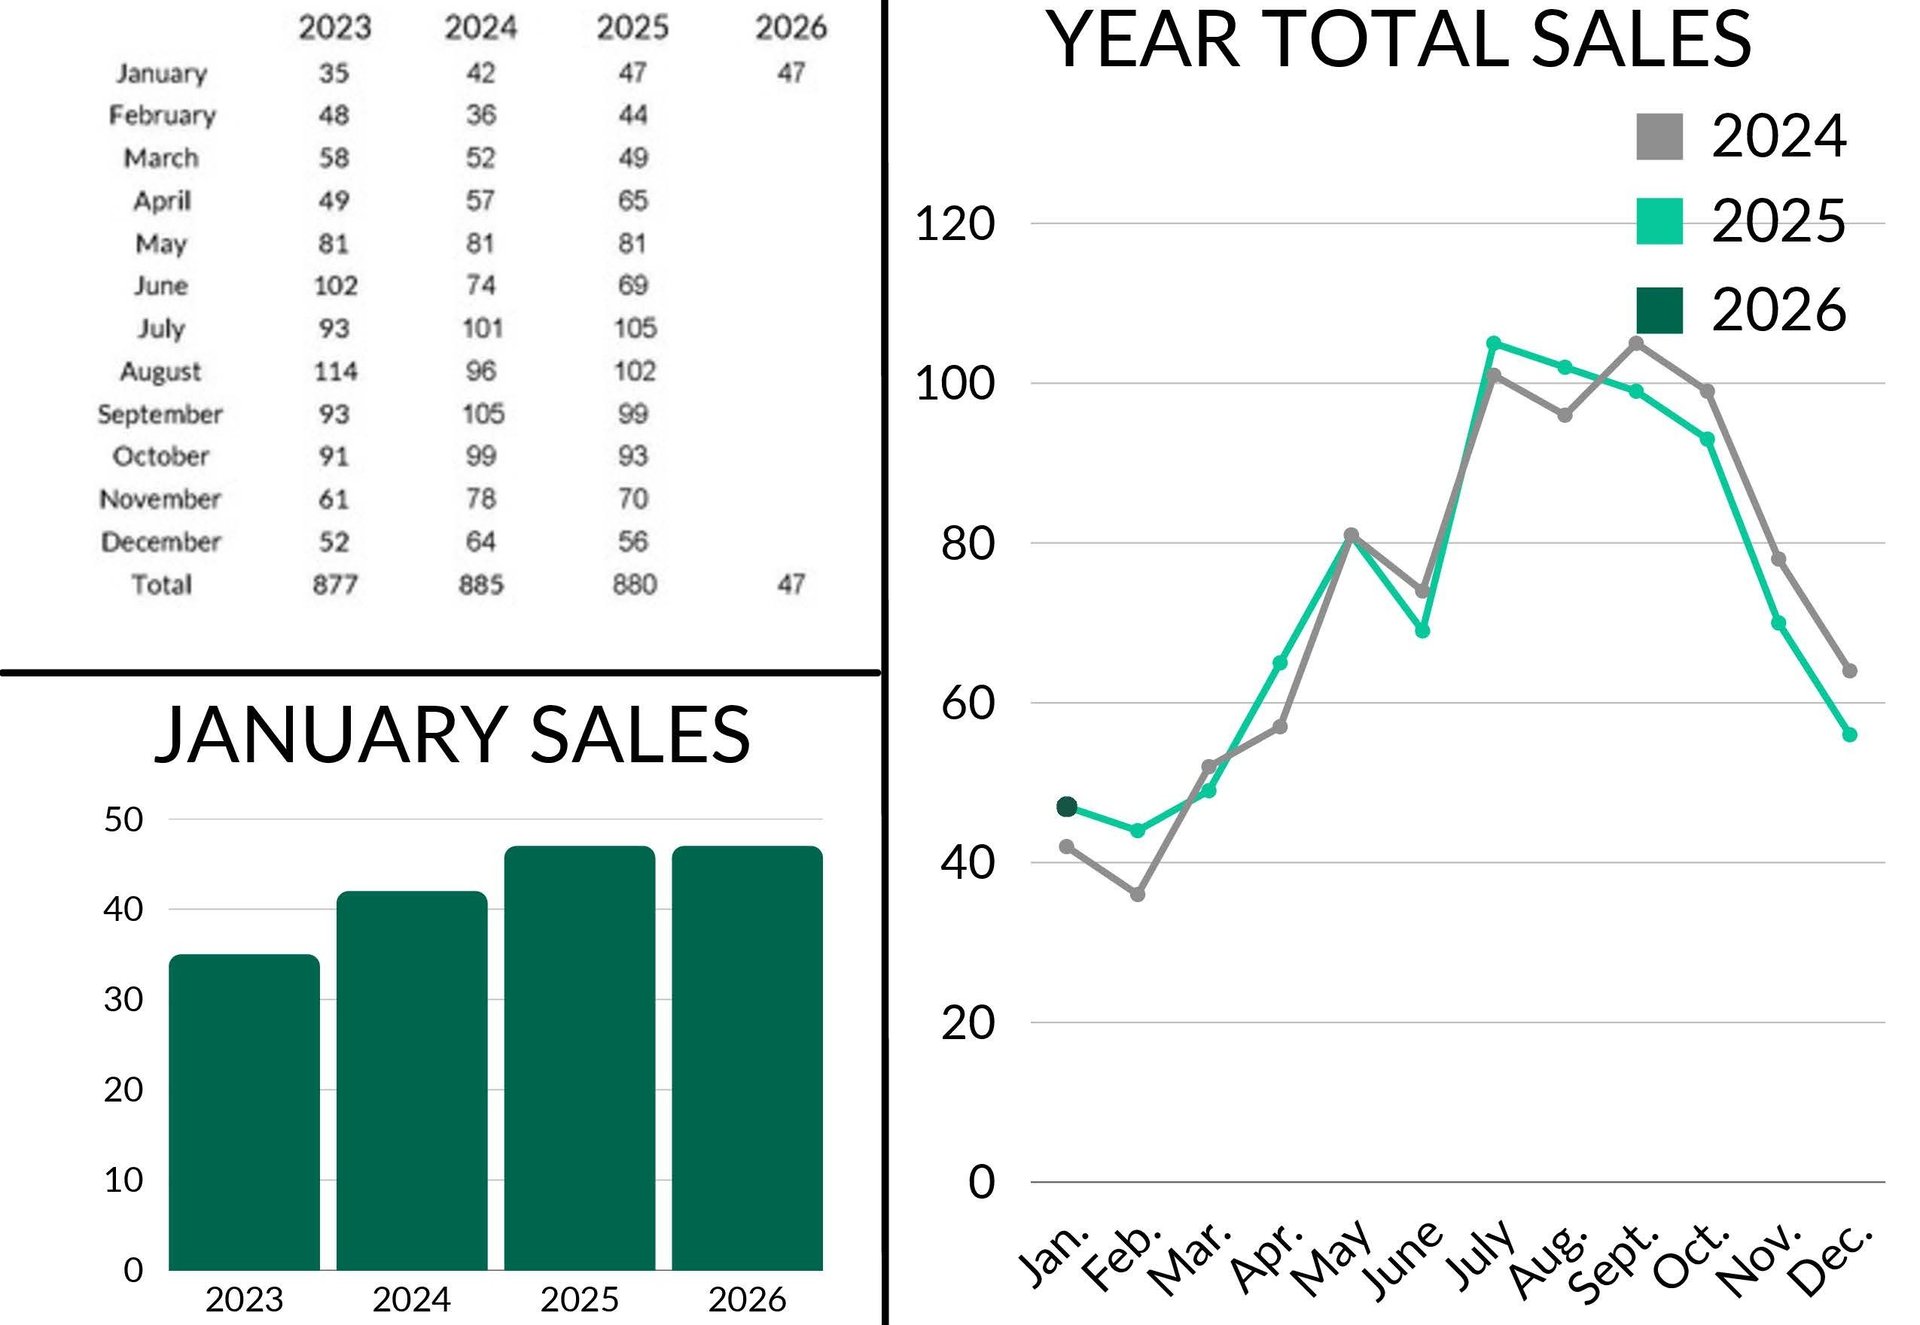
January Sales:
- January 2026 Total Sales: 47
- December 2025: 56 - 🠇19.15%
- January 2025: 47 - no change
We expect to see a decrease in sales from December to January. December contracts are typically written in October and November when buyer activity is still strong, whereas contracts for January closings are often executed during the holiday season, when buyer activity slows down significantly . It is, however, unique to have the exact same number of sales two years in a row. This data aligns with our 2026 prediction that this year will follow a similar pattern as 2025, with prices continuing to recalibrate and much less fluctuation.
Inventory:
- Active Listings: 284
- December 2025: 300 - 🠇5.63%
- January 2025: 235 - 🠅 20.85%
- Pending (under contract) Listings: 88
- December 2025: 63 - 🠅 39.68%
- January 2025: 81 - 🠅 8.64%
We are happy to see a 20% increase in inventory YoY. Many sellers choose to wait until spring to list their home, but due to the mild winter we’ve seen continuous activity in our area. This is also true for pending listings, with an increased number of homes under contract in January compared to December, as well as January 2025.
Price Trends:
- Average Sales Price: $763,231
- December 2025: $884,633 - 🠇 15.91%
- January 2025: $815,634 - 🠇 6.87%
- Median Sales Price: $695,500
- December 2025: $682,500 - 🠅1.9%
- January 2025: $635,000 - 🠅 9.53%
The average and median sales price reflect year-to-date totals, and this early in the year these numbers are easily influenced by notably high and low sales. In January, the median sales price settled at $695,500 which is about 2% more MoM and 10% YoY. As 2026 progresses, we will see both of these statistics begin to take more shape and more accurately represent our market.
Time on the Market:
- Average Days on Market: 127 days
- December 2025: 104 - 🠅 23 days
- January 2025: 115 - 🠅 12 days
- Median Days on Market: 101 days
- December 2025: 74 - 🠅 27 days
- January 2025: 100 - 🠅 1 day
There are increases in average and median days on market both YoY and MoM. As the market has been recalibrating, we are seeing more homes with price reductions and staying on the market for longer.
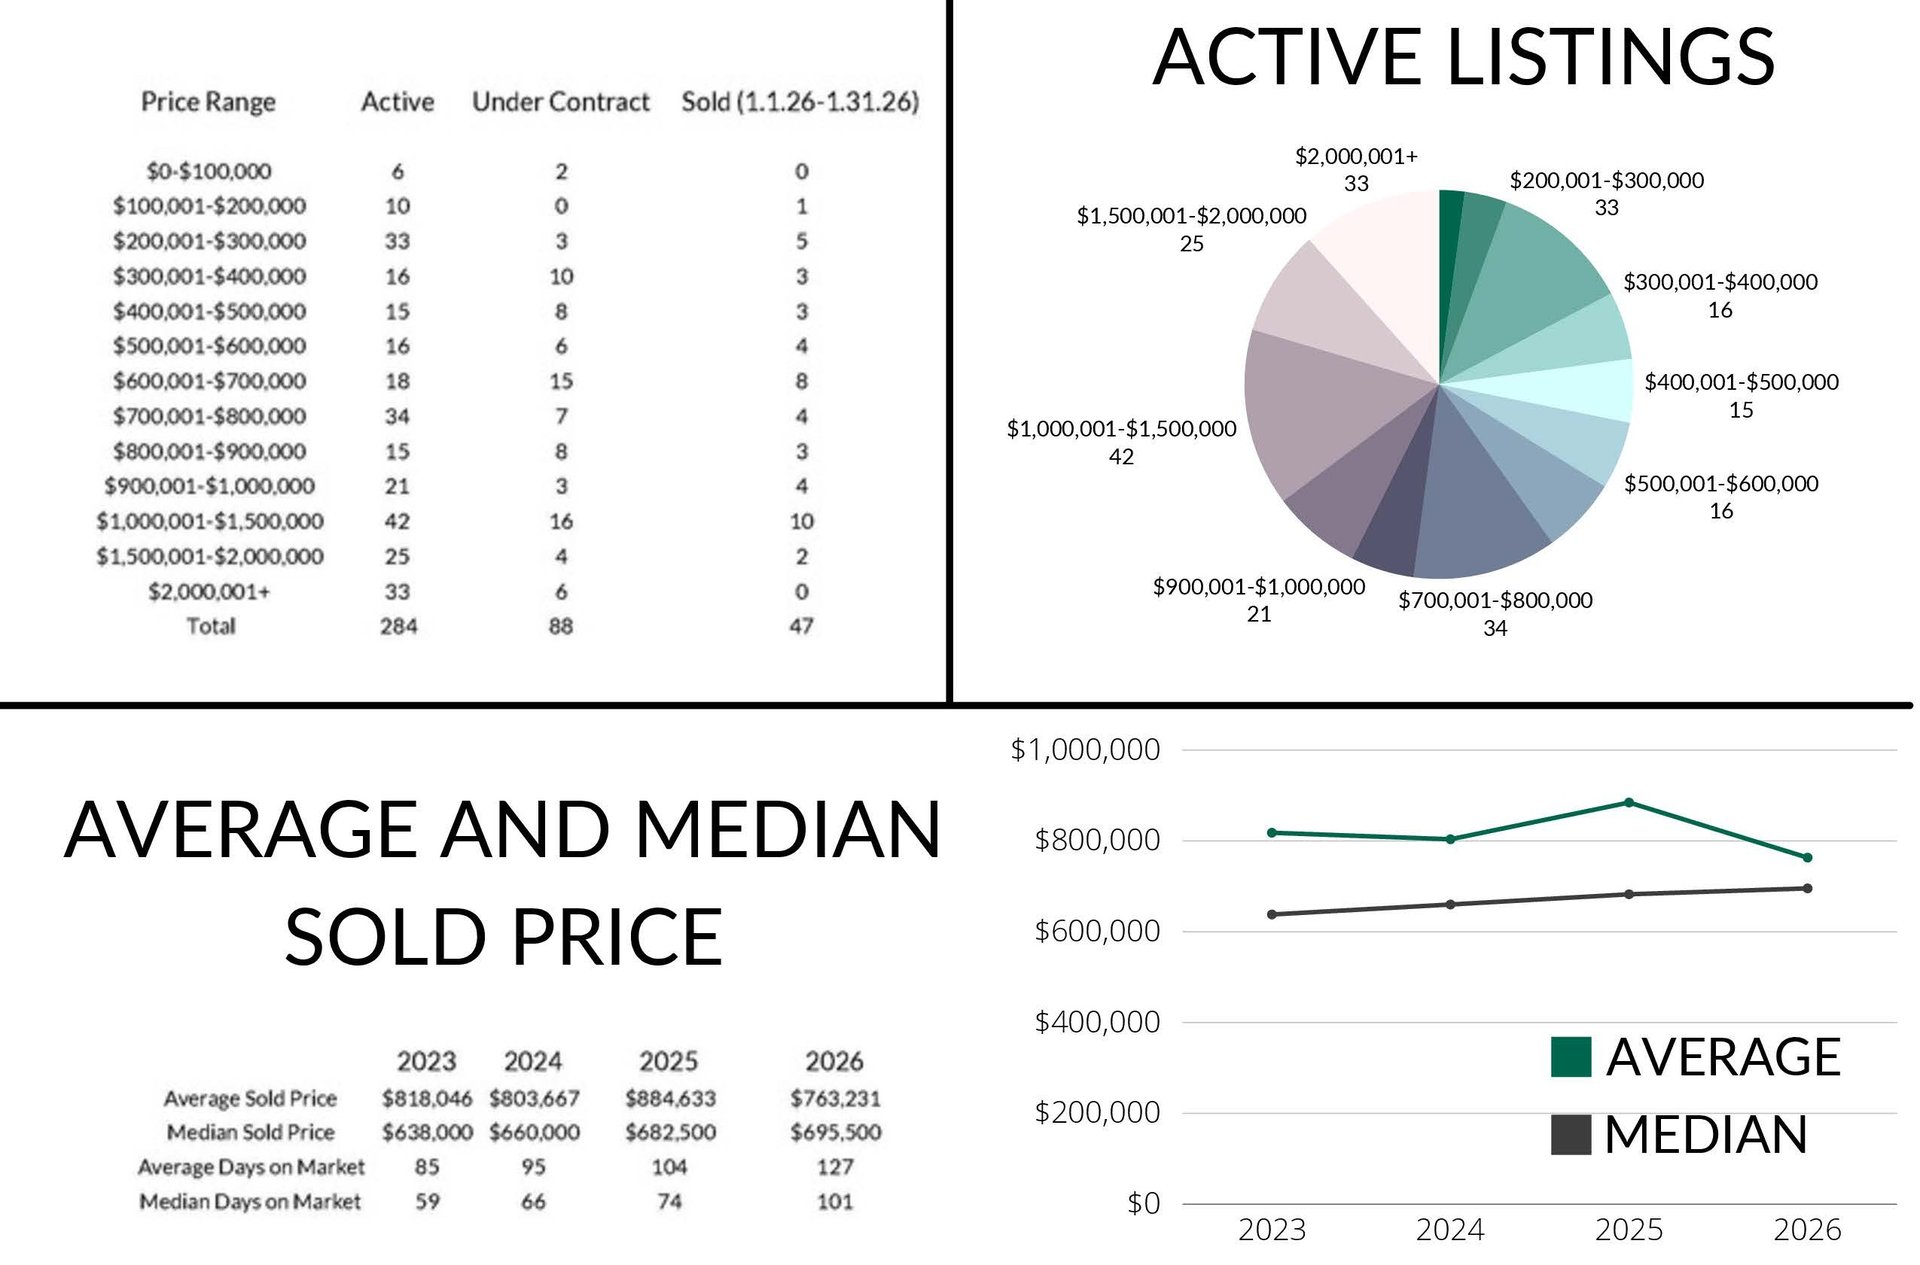
Trending Price Ranges:
- $200,001 - $300,000
- 33 active listings
- $700,001 - $800,000
- 34 active listings
- $1,000,000+
- 42 active listings between $1,000,001 - $1,500,000
- 25 active listings between $1,500,001 - $2,000,000
- 33 active listings at $2,000,001+
- 12 sold listings in Jan. 2026, all under $1,700,000
The substantial number of listings under $300,000 is primarily made up of resort area condo listings and manufactured units not on real property. Homes offered at $1,000,000+ account for more than one-third of active listings as well as one-quarter of sales; which supports the heightened median sales price.
With 2026 just beginning, we look forward to another year full of opportunities in the La Plata County real estate market. For more residential or land, commercial, and farm and ranch information, please contact The Durango Team at The Wells Group.