Halfway through the year, the La Plata County 2026 residential real estate market has been steady, with few changes month-over-month (MoM) and year-over-year. These statistics allow us to track and analyze the market to gain deeper insight into local market trends and seasonal changes. We evaluate inventory, sales, prices, and days on market to provide an overview for buyers and sellers in the La Plata County market.
July Sales:
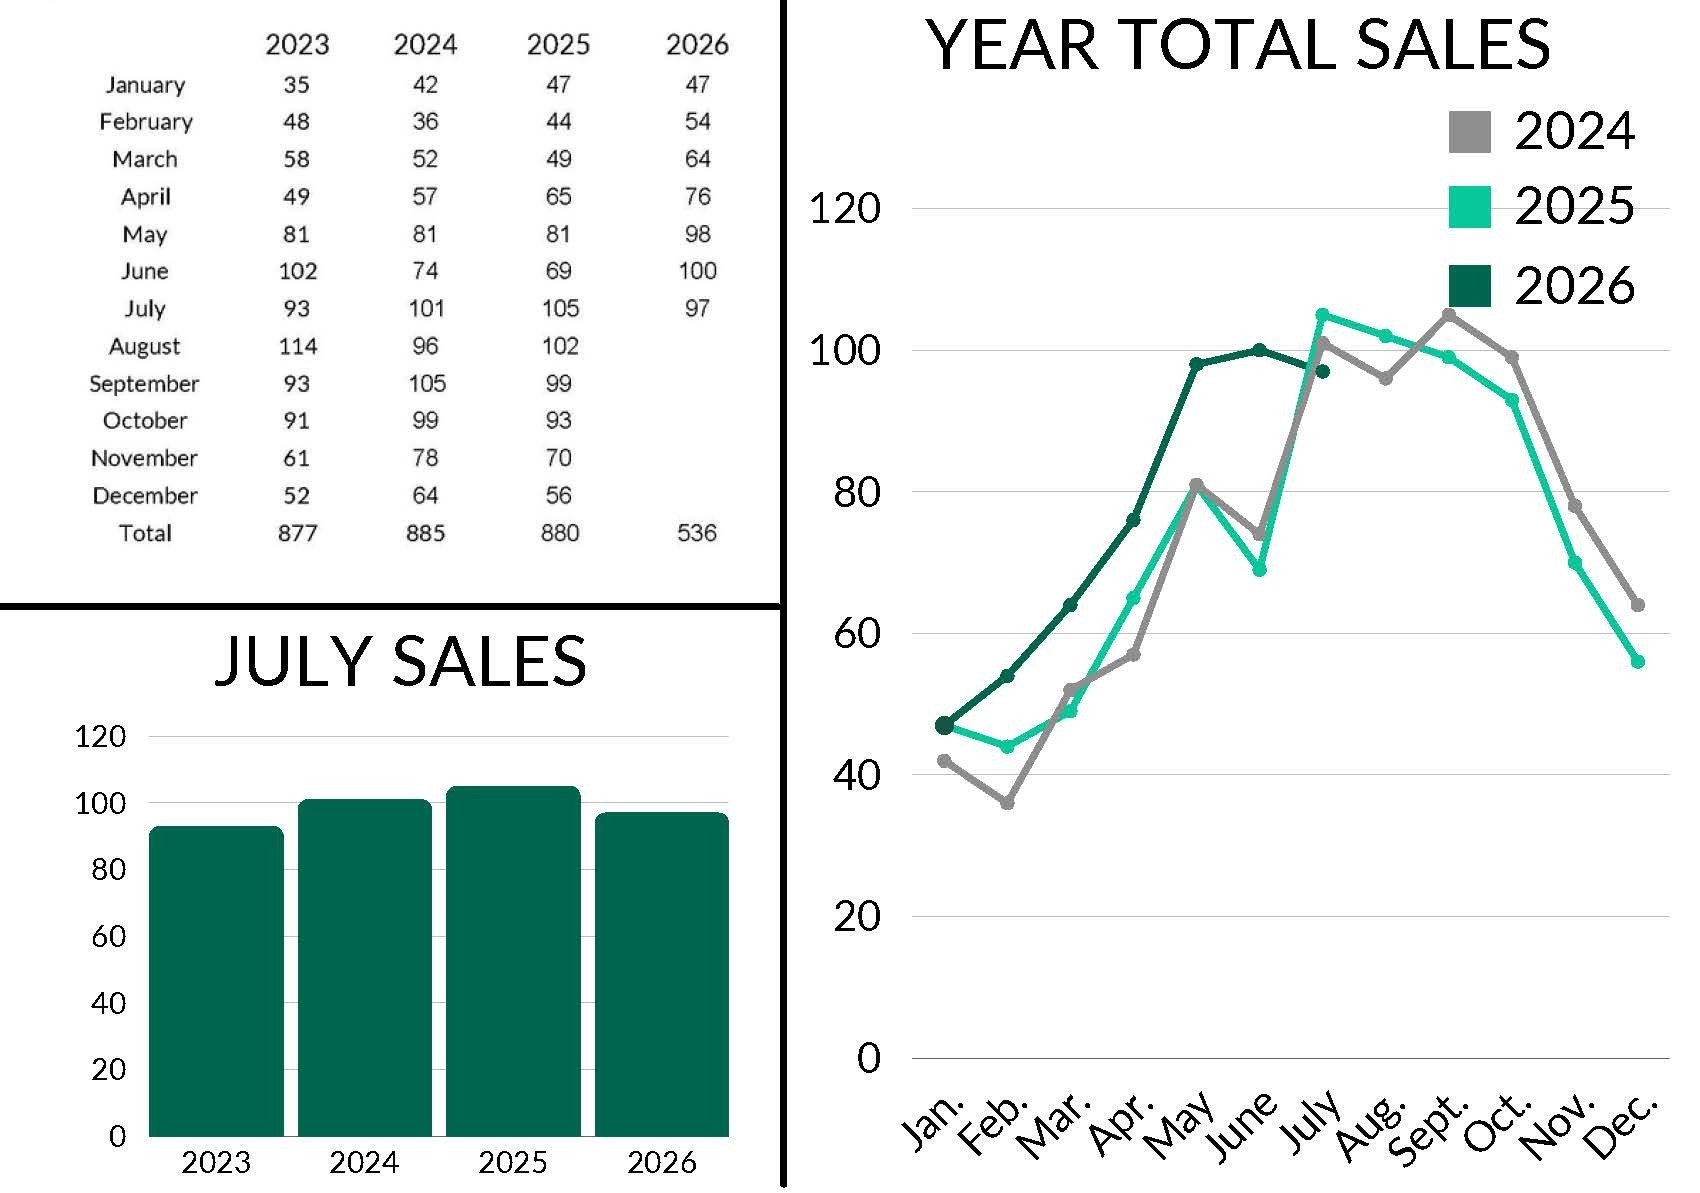
July 2026 Total Sales: 97
June 2026: 100 - 🠇 3.1%
July 2025: 105 - 🠇 7.62%
Year-to-date (YTD) sales: 536
2025: 461 - 🠅 16.27%
2024: 443 - 🠅 20.99%
We saw a slight slowdown in July activity, with sales down 3% from last month, and 8% from July 2025. YTD, we’re still substantially above the first seven months of 2024 and 2025, which can be attributed in large part to increased inventory.
Inventory:
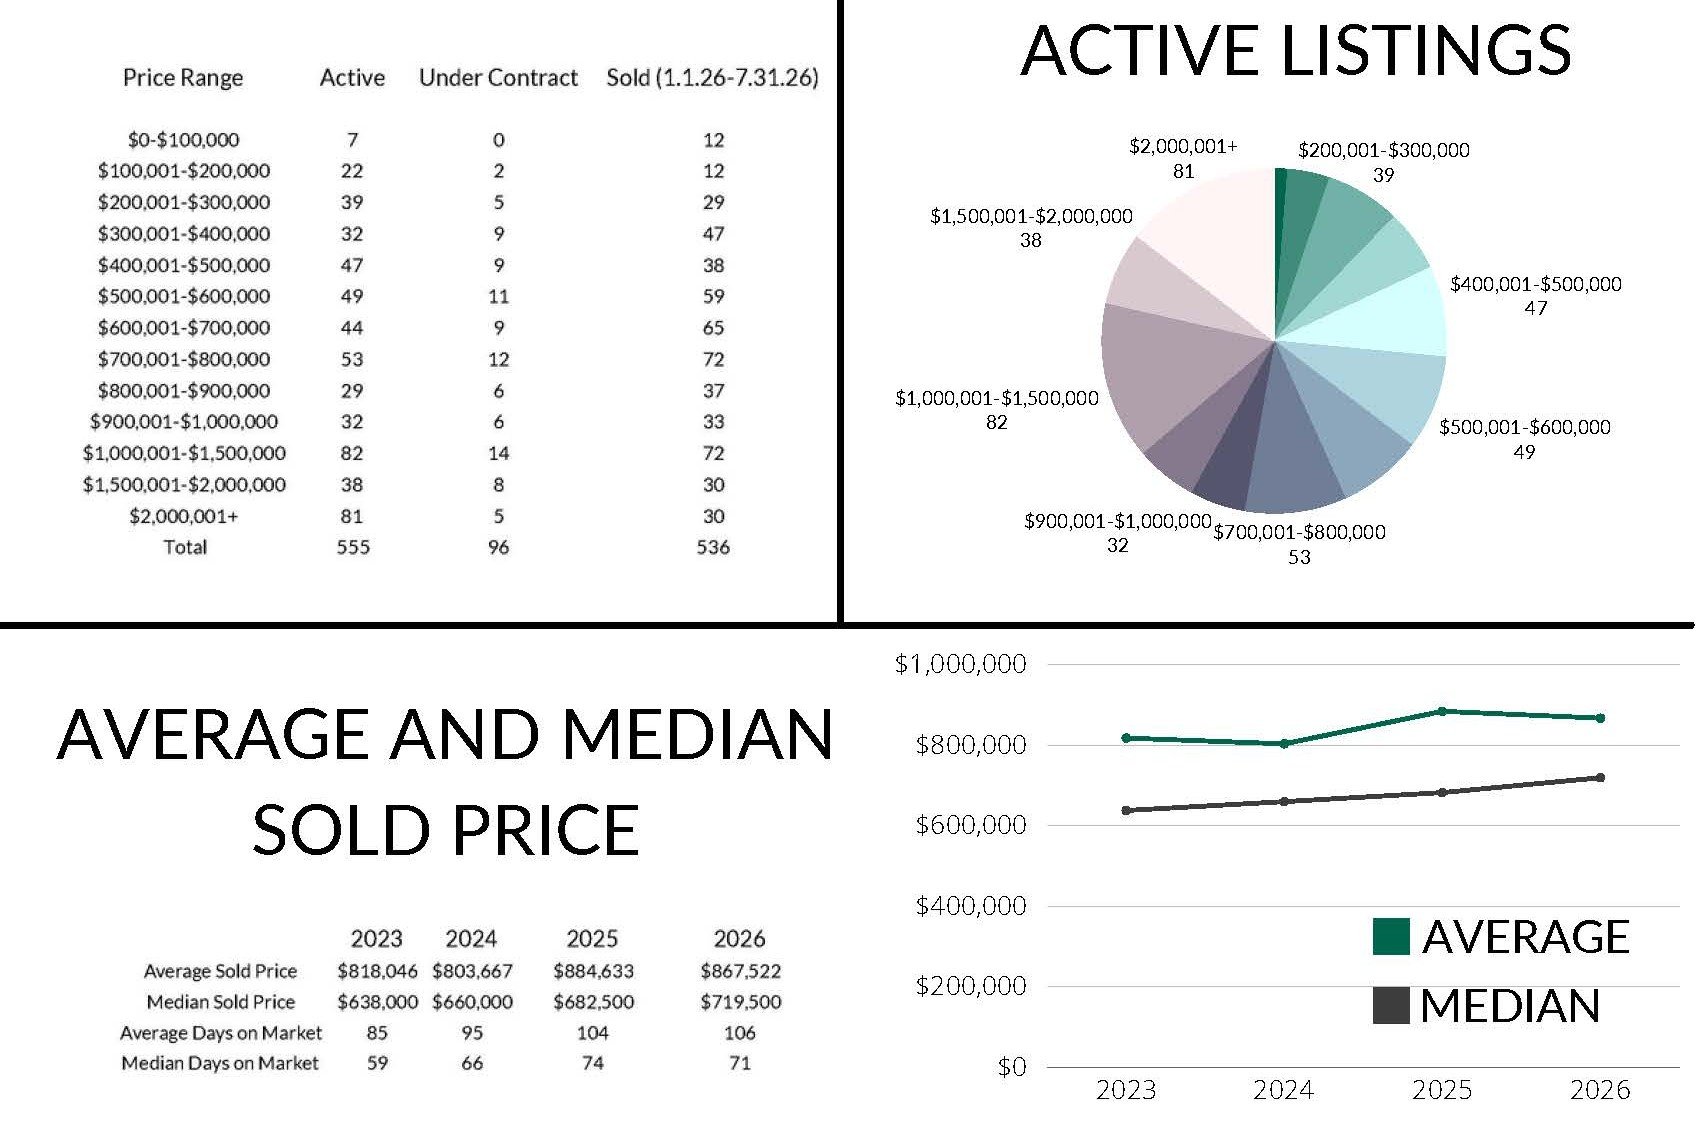
Active Listings: 555
June 2026: 550 - 🠅 0.9%
July 2025: 469 - 🠅 18.34%
Pending (under contract) Listings: 96
June 2026: 107 - 🠇 10.28%
July 2025: 136 - 🠇 29.41%
Even though the MoM inventory saw little change, the 18% YoY growth is more significant. The La Plata County residential inventory has continued to replenish after reaching historic lows in 2021 and 2022. This increase in inventory not only gives buyers more choices and opportunities but also gives sellers a larger buyer pool as the market balances. Within the past month, our inventory growth has shifted the market to a more buyer-friendly market (6+ months’ supply) for the first time in years. However, despite the jump in inventory, it is notable that pending sales are down both MoM and YoY, which should be reflected in the number of sales in August.
We can see this play out with fewer showings, more price reductions, and an overall increase in days on market YoY. We understand the frustrations that come with buying and selling real estate, and while data can help explain some trends, there are also other outside factors and unknowns that affect our local market. We have seen activity pick up over the last week, so we expect a strong finish to the summer and continued activity into the fall.
Price Trends:
Average Sales Price: $867,522
June 2026: $876,282 - 🠇 1.01%
July 2025: $829,207 - 🠅 4.62%
Median Sales Price: $719,500
June 2026: $720,000 - 🠇 0.07%
July 2025: $686,000 - 🠅 4.88%
Both the average and median sales prices stayed fairly consistent MoM, with just a $500 difference in the median sales price. YoY, both have increased by just under 5%, which is about the typical annual growth we expect to see in a balanced market. As the year progresses, we are seeing these price trends normalize somewhat as more sales data is compiled, providing a more complete picture.
Time on the Market:
Average Days on Market: 106 days
June 2026: 111 - 🠇 5 days
July 2025: 94 - 🠅 12 days
Median Days on Market: 71 days
June 2026: 73 - 🠇 2 days
July 2025: 65 - 🠅 6 days
Despite the market feeling a little slow lately, the small decrease in days on market MoM, paired with the moderate increase YoY, reinforces continued demand and activity for La Plata County homes. We know that homes are taking longer to sell than they did during the COVID-19 pandemic real estate boom, and while it may seem like homes are sitting longer, these data points show that, overall, our market continues to thrive. It remains important for sellers to price their homes accurately and competitively, depending on timeline and goals.
Trending Price Ranges:
$300,001 - $400,000
47 sold YTD
$400,001 - $800,000
193 active listings
41 pending
234 sold YTD
$1,000,000+
82 active listings between $1,000,001 - $1,500,000
38 active listings between $1,500,001 - $2,000,000
81 active listings over $2,000,001
27 $1,000,000+ pending listings
132 $1,000,000+ listings sold year-to-date
At the entry level, 47 homes have sold in the $300,001 - $400,000 price category, with another 53 between $1 - $300,000. Together, these sales make up nearly one-fifth of the market. The $400,001 - $800,000 range has accounted for 234 sales, or 44% of all homes sold YTD, supporting the current median sales price. This is also the most common range among pending listings and includes 35% of the available inventory. At the upper end of the market, there are 201 listings over $1,000,001, representing 36% of all active listings. This same category accounts for 28% of pending listings, and 25% of all residential sales YTD.
These numbers remain very similar to last month's breakdown of market share among active, pending, and sold listings.
There are many factors, both locally and nationally, to consider, including the political climate, mortgage rates, insurance, and the impact of natural disasters. As the market continues to evolve, we continue to strive to provide five-star buying and selling experiences in Southwest Colorado by monitoring this information and using it to educate our clients and provide accurate guidance and support. Please contact The Durango Team at The Wells Group for genuine care from start to finish and beyond.