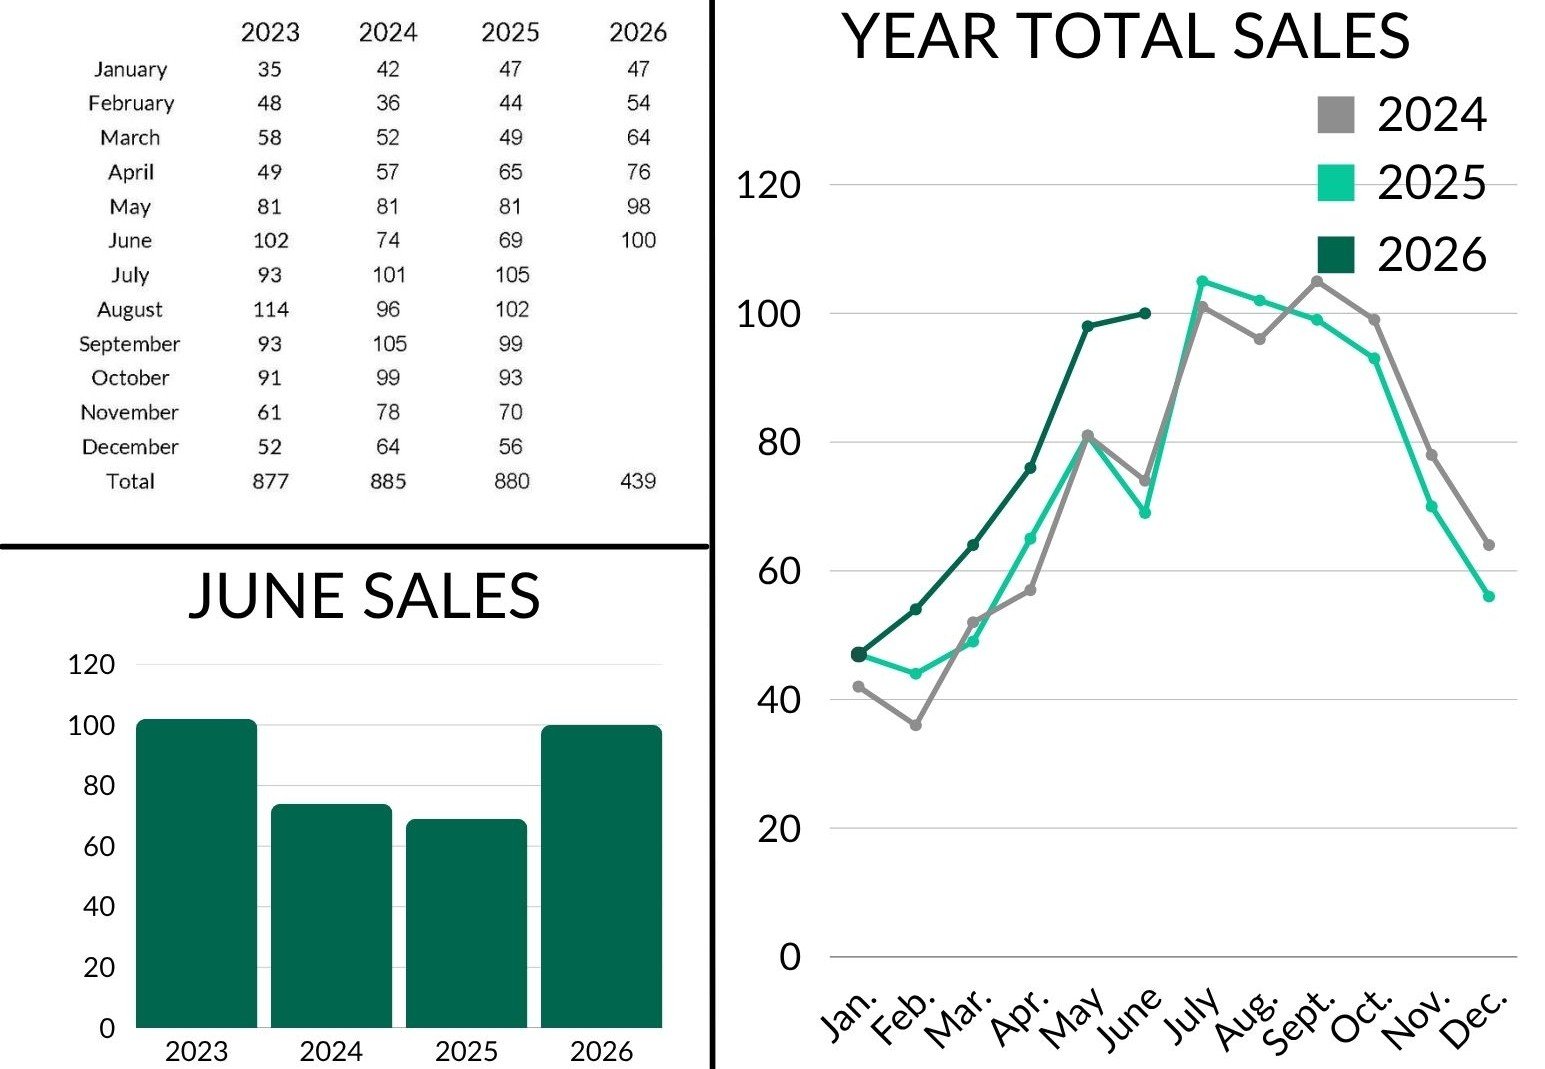
What a difference a year can make in real estate! La Plata County recorded 100 residential sales in June - a nearly 45% increase over June 2025 - while the number of active listings also continued to grow. By collecting and analyzing month-over-month (MoM) and year-over-year (YoY) statistics, we can look beyond the market’s typical seasonal shifts and better understand what changes in inventory, sales, prices, and days on market mean for local buyers and sellers.
June Sales:
- June 2026 Total Sales: 100
- May 2026: 98 - 🠅 2.04%
- June 2025: 69 - 🠅 44.93%
- Year-to-date (YTD) sales: 439
- 2025: 355 - 🠅 23.66%
- 2024: 342 - 🠅 28.36%
With exactly 100 sales, June 2026 recorded a nearly 45% YoY increase and brought the county’s year-to-date total to 439. This represents an increase of nearly 24% compared with the same period in 2025 and more than 28% compared with 2024. Here is a breakdown of our submarkets:
- 70 sales in the Bayfield/Vallecito area
- 20 sales in the Ignacio area
- 13 sales in the Hesperus area
- 336 in the Durango area: 171 rural, 122 in-town, 43 resort area
Durango accounts for the largest portion of La Plata County real estate activity, which is expected given that it has the county’s largest population center. It is also encouraging to see continued activity in the surrounding communities, particularly in the Bayfield area.
Inventory:
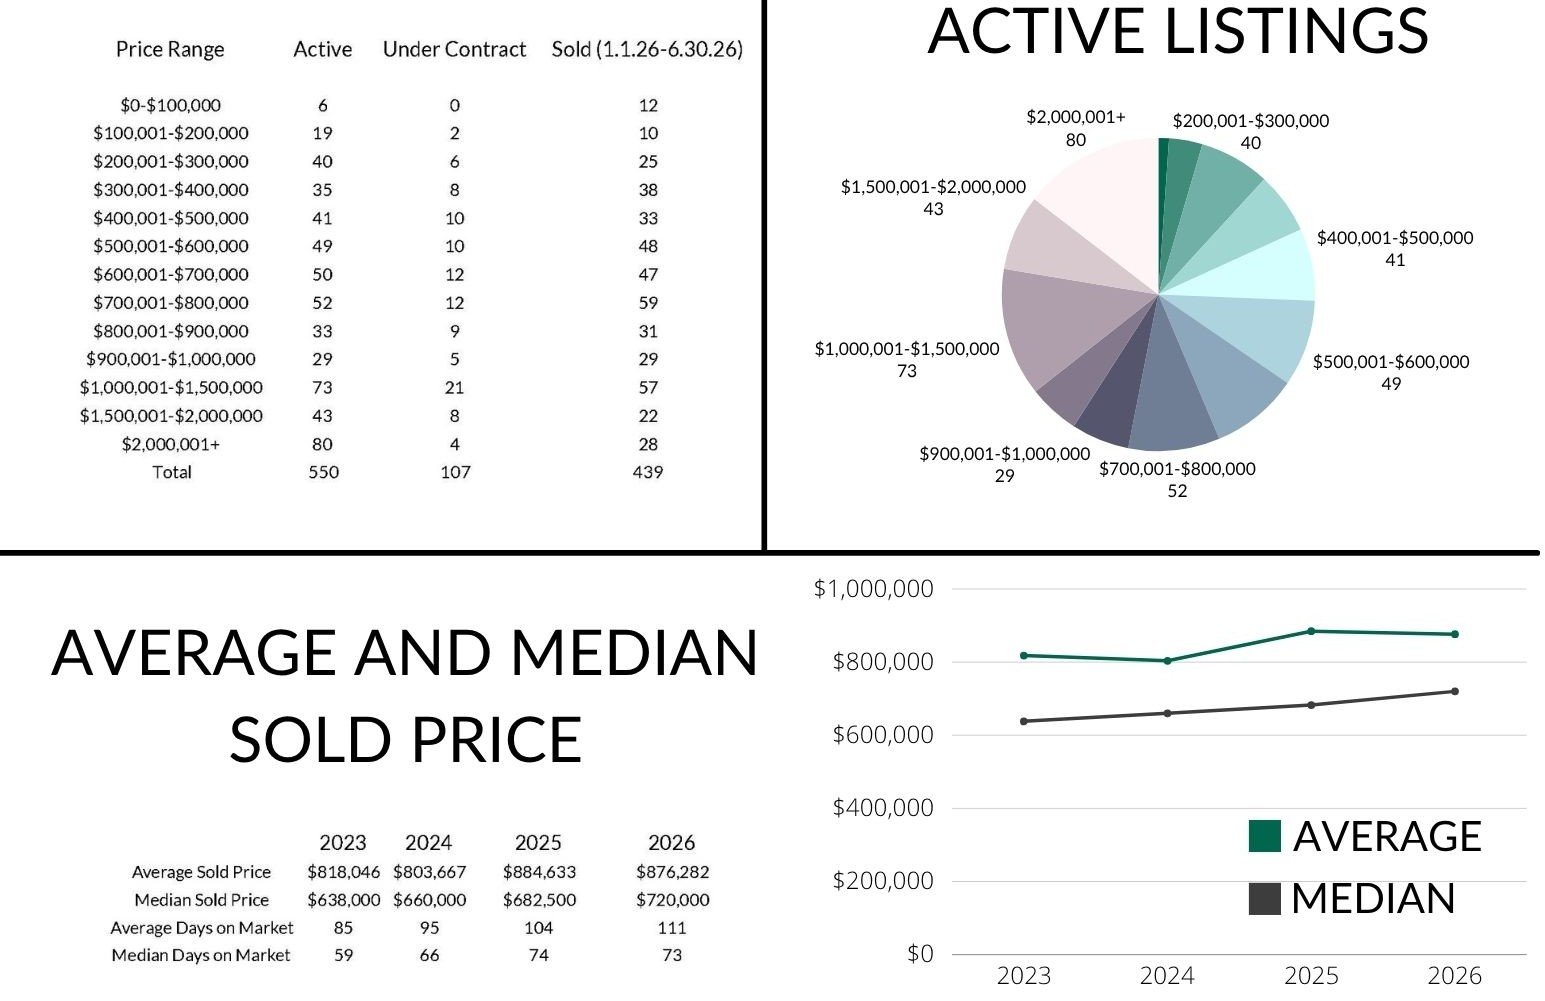
- Active Listings: 550
- May 2026: 479 - 🠅 14.82%
- June 2025: 466 - 🠅 18.03%
- Pending (under contract) Listings: 107
- May 2026: 119 - 🠇 10.08%
- June 2025: 145 - 🠇 26.21%
The MoM and YoY growth in inventory is one of the most important data points. After more than two years of historically low inventory, buyers now have a broader selection of active properties, providing them with more choices and opportunities to find a home that meets their needs. In turn, sellers may also benefit as increased inventory encourages more buyers to enter or reenter the market. Buyers who have had the opportunity to compare properties and better understand current market conditions and values tend to feel more confident in their decisions, which typically leads to stronger, more solid contracts.
While closed sales remained strong, pending sales decreased both MoM and YoY - a trend that some of our sellers are experiencing firsthand. Showing activity during the past four to six weeks has been notably slower than we typically expect at this time of year. Because June closings generally reflect contracts written during April or May, we are curious to see the July numbers and evaluate whether this was just a brief early-summer slowdown, or representative of a broader shift.
Price Trends:
- Average Sales Price: $876,282
- May 2026: $869,986 - 🠅 0.72%
- June 2025: $787,608 - 🠅 11.26%
- Median Sales Price: $720,000
- May 2026: $705,000 - 🠅 2.13%
- June 2025: $655,000 - 🠅 9.92%
Average and median sales prices remained relatively stable MoM, although both increased significantly YoY. The average, now at $876,282, is more than $150,000 higher than the median sales price of $720,000. This gap illustrates how a relatively small number of high-end luxury sales can pull the average upward. The median sales price generally provides a clearer picture of the broader market because it is less influenced by extremely low- or high-priced sales. With YoY increases of approximately 10% in both metrics, we will be watching to see whether prices continue to rise or begin to level out as inventory moves closer to meeting buyer demand.
Time on the Market:
- Average Days on Market: 111 days
- May 2026: 116 - 🠇 5 days
- June 2025: 98 - 🠅 13 days
- Median Days on Market: 73 days
- May 2026: 83 - 🠇 10 days
- June 2025: 68 - 🠅 5 days
Days on market have decreased MoM, which is consistent with the summer season. However, homes are taking longer to sell than they did in June 2025. With fewer listings available last year, buyers had to act more quickly to avoid losing out. Current marketing times remain longer than the unusually fast one- to two-month periods we experienced during the Covid-era. In our market, we’ve noticed certain market segments attracting buyers and going under contract quickly, while others, even when priced competitively, may receive less activity and stay on the market longer.
Trending Price Ranges:
- $1 - $500,000
- 141 active listings
- $500,001 - $800,000
- 151 active listings
- 34 pending
- 154 sold year-to-date
- $1,000,000+
- 73 active listings between $1,000,001 - $1,500,000
- 43 active listings between $1,500,001 - $2,000,000
- 80 active listings over $2,000,001
- 33 $1,000,000+ pending listings
- 107 $1,000,000+ listings sold year-to-date
The lower- to mid-range price categories saw moderate MoM inventory growth of approximately 12-13%, however the $1,000,001+ market experienced a more notable 18.79% MoM increase. This category now accounts for 36% of active listings, 31% of pendings, and 24% of YTD sales. The popular $500,001 - $800,000 mid-range category accounts for about 28% of active listings, nearly one-third of pending listings and 35% of the YTD sales. Although approximately 25% of active listings are priced at $500,000 or below, the luxury market continues to exert upward influence on the average list price, which increased both MoM and YoY and now stands at $1,328,747.
More inventory would ordinarily be expected to generate additional activity, particularly during Southwest Colorado’s popular summer season. With wildfires in the area, fluctuating mortgage rates, and other outside factors constantly changing, we would love to put our experience and local knowledge to work for you. Please contact The Durango Team at The Wells Group to discuss your real estate goals.