With the first quarter of 2025 now behind us, it’s a great time to reflect on recent market activity and compare it to Q1 of 2024 for further insight. While La Plata County’s residential real estate trends are shaped by local demand, they’re also influenced by broader economic factors beyond Southwest Colorado. By analyzing these statistics, our goal is to provide thoughtful, up-to-date guidance for buyers and sellers navigating today’s market.
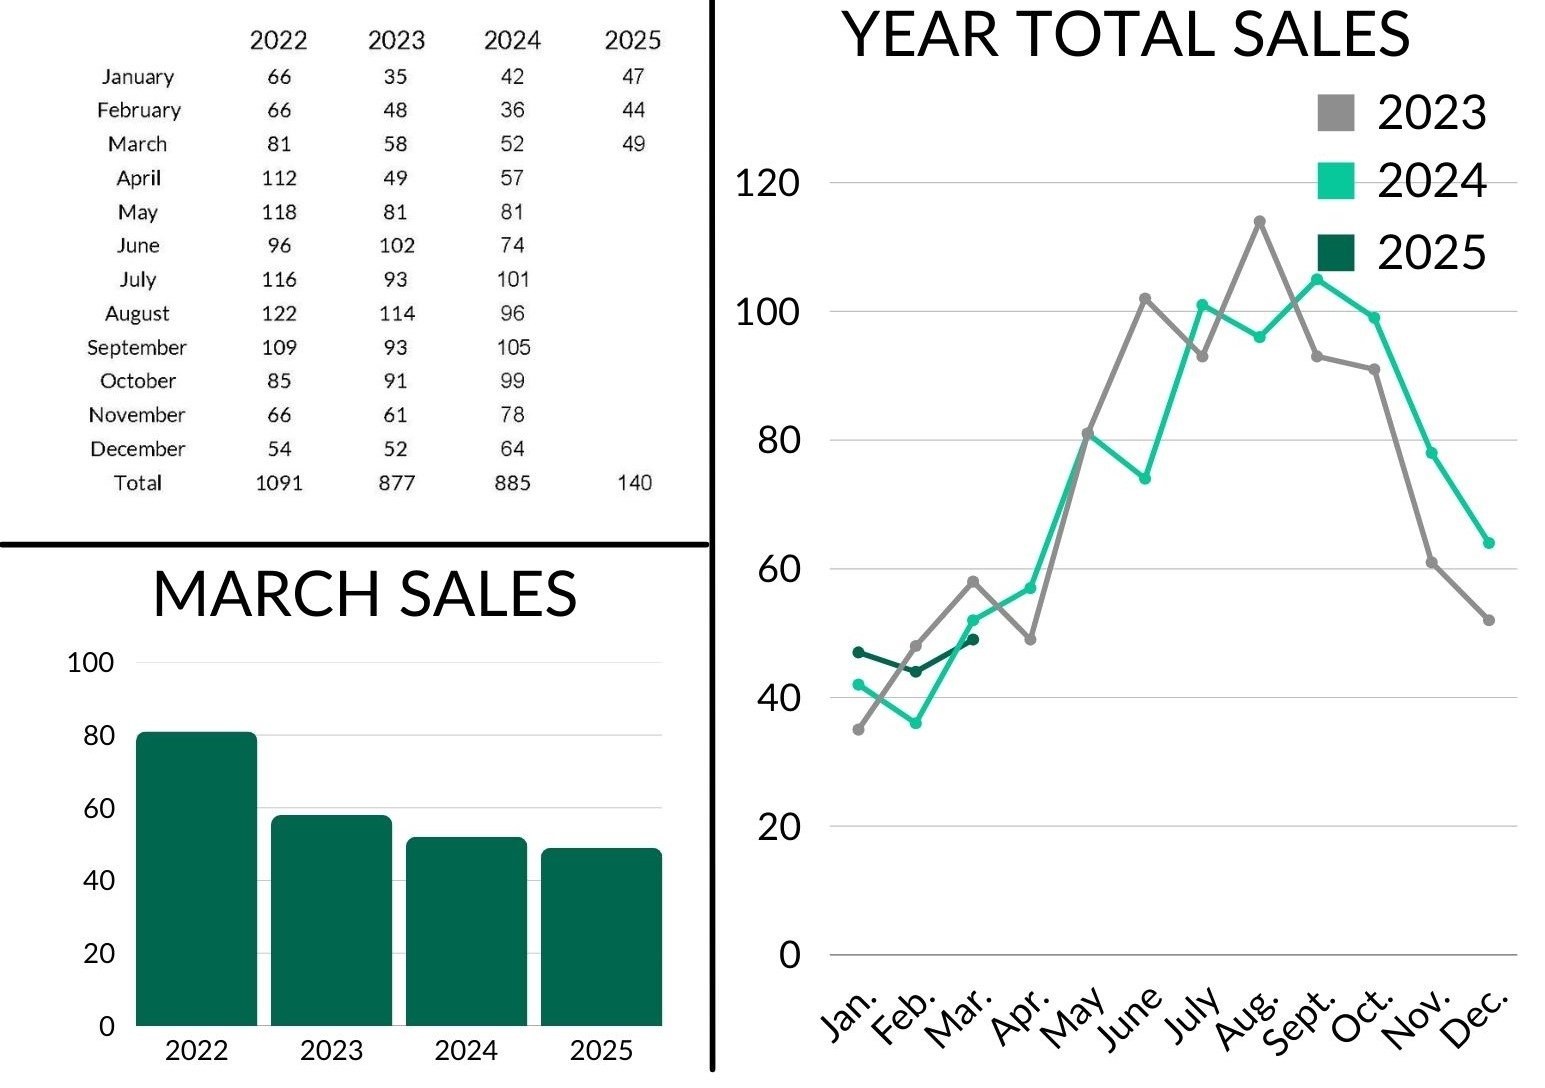
March Sales:
March total: 49
- Down 3 sales year-over-year
- Up 5 from February
Year-to-date sales: 140
So far, 2025 is trending slightly ahead of last year, with a 7% increase in sales due to a busier January and February. Part of this is likely attributed to a mild winter. While overall sales are nearly flat with just one fewer sale than 2023, activity remains well below the peak of the 2022 real estate boom, which saw 213 sales in the first quarter alone.
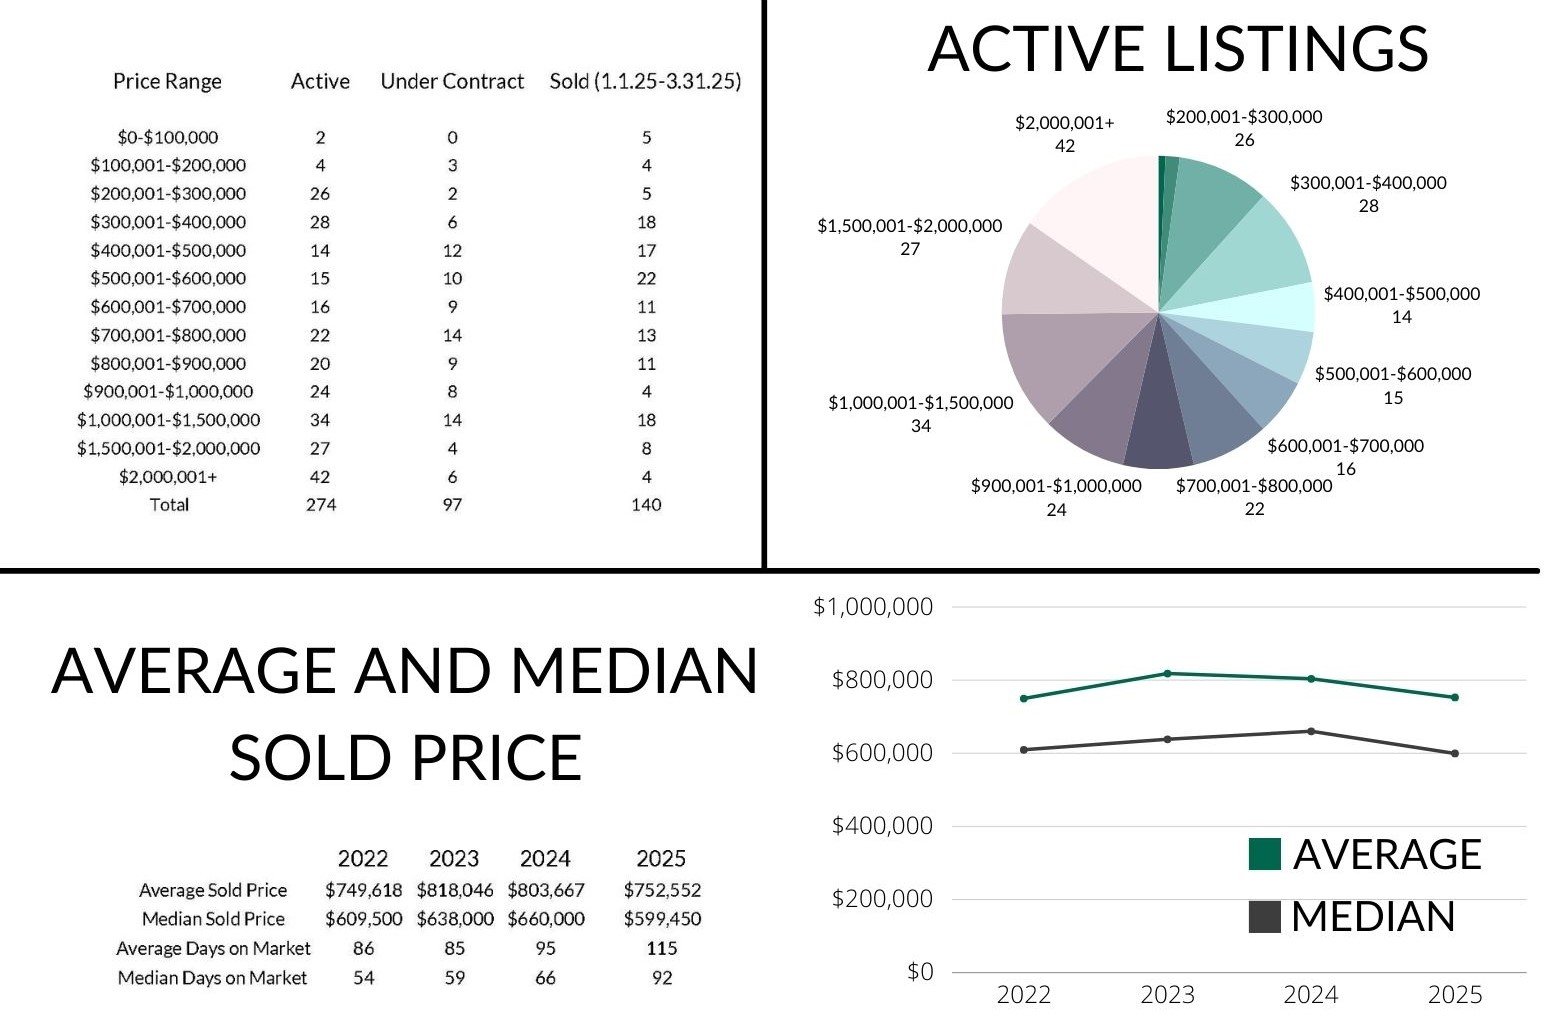
Price Trends:
Average Sales Price: $752,552
- Down just over $3,500 than February 2025
- Up $48,000 year-over-year
Median Sales Price: $599,450
- Down $14,000 month-over-month
- Flat compared to Q1 2024
The average sales price tends to run higher due to the influence of larger, luxury transactions, while the median provides a more balanced view of the market by minimizing the impact of outliers. The lack of significant year-over-year price growth is notable - while some appreciation is typically expected this plateau may reflect affordability concerns, limited inventory in key segments, high interest rates, or a more cautious buyer pool. With the active market currently driven by the $1M+ listings, we expect these sales to gradually push the overall average upward as the year progresses.
Time on the Market:
Average Days on Market: 115 days
- Only one day shorter than February 2025
- Three days faster year-over-year
Median Days on Market: 92 days
- 7 days quicker month-over-month
- One day quicker year-over-year
Inventory:
Active listings: 274
- Up 13% from Q4 2024
- 14% higher year-over-year
Pending (under contract) listings: 97
- 67% more than Q4 2024
- 17% higher year-over-year
The notable increases in both inventory and pending listings are encouraging signs for an active spring and summer market. For buyers, more active listings means more options to choose from, although we anticipate that accurately priced homes, especially in high demand areas like in-town Durango, will continue to move quickly. For sellers, the strong number of pending sales reflects ongoing demand for homes in the area, signaling a healthy level of buyer interest.
Trending Price Ranges:
$1,000,000+
- 34 active listings between $1,000,001 - $1,500,000
- 27 active listings between $1,500,001 - $2,000,000
- 42 active listings over $2,000,001
- These three categories account for 103 listings, putting 38% of all inventory in the luxury segment
- This continues to remain the top performer for pendings (25%) and closed sales (21%)
$700,001 - $800,000
- Tied for the most popular pending category last month
$200,001 - $400,000
- Another 54 active listings
As we move into Q2 2025, we do anticipate the La Plata County market activity to continue to increase, but perhaps not as significantly as in years past. With outside factors continuing to shape local trends, now is a great time to stay in touch and informed. Please don’t hesitate to reach out to The Durango Team at The Wells Group - we’re here to help you navigate the market with confidence.