After a mild winter and an early start to spring activity, the La Plata County residential market is gaining momentum. The first three months of 2026 showed above-average activity, an encouraging start to the year. Below, we’ll take a closer look at the key statistics, both month-over-month (MoM) and year-over-year (YoY), to provide insight into what’s happening locally.
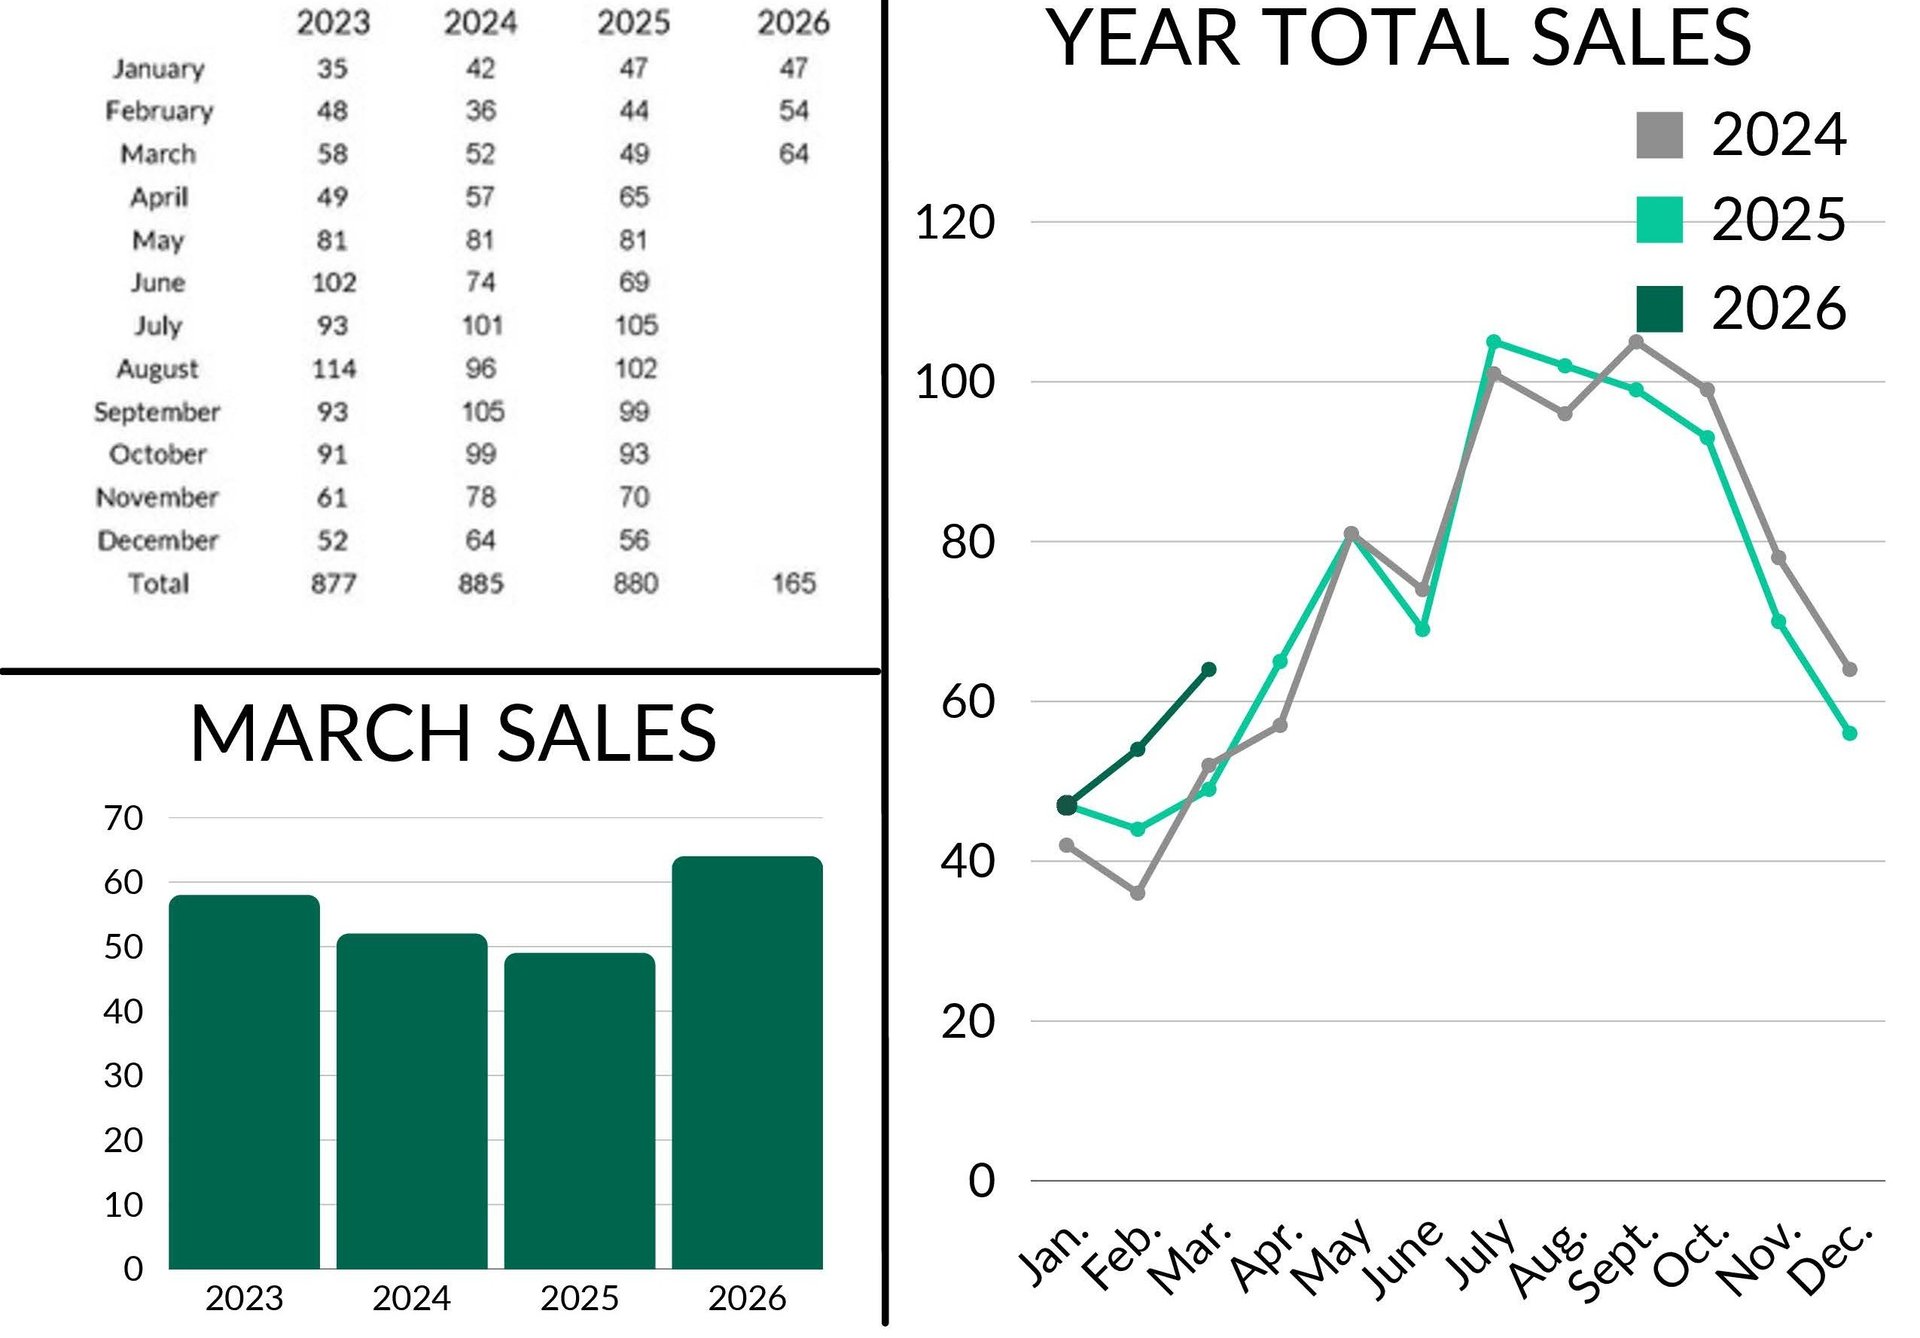
March Sales:
- March 2026 Total Sales: 64
- February 2026: 54 - 🠅 18.52%
- March 2025: 49 - 🠅 30.61%
- Year-to-date (YTD) sales: 165
- 2025: 140 - 🠅 17.86%
- 2024: 130 - 🠅 26.92%
Q1 2026 saw more sales than Q1 in 2025, 2024, and 2023 - a solid first quarter in La Plata County. March was a strong month, due in large part to the light winter and early growth in inventory. This is a trend we’ve seen for many years; late March into early April marks the start of the more active spring and summer season. Increased options for buyers helped drive this activity, and we anticipate this momentum continuing in the coming months.
Inventory:
- Active Listings: 352
- February 2026: 313 - 🠅 12.46%
- March 2025: 274 - 🠅 28.47%
- Pending (under contract) Listings: 108
- February 2026: 75 - 🠅 44%
- March 2025: 97 - 🠅 11.34%
Inventory has continued to rebuild both MoM and YoY, now nearly 30% higher than March 2025. This is one of the most important trends and is healthy for our market, though it can be frustrating for sellers. With over 10% growth MoM, we hope this trend continues into summer, giving both buyers and sellers the options needed to move. We like to see the increased number of pending sales as we close out Q1, which also tracks closely with the rise in available inventory.
Price Trends:
- Average Sales Price: $832,454
- February 2026: $839,885 - 🠇 0.89%
- March 2025: $752,552 - 🠅 10.62%
- Median Sales Price: $691,500
- February 2026: $695,000 - 🠇 0.51%
- March 2025: $599,450 - 🠅 15.36%
Since these price trend numbers are based on year-to-date totals, a few very high or very low sales can impact the average and median prices significantly. As we progress through the year and sales continue to occur, these numbers will more accurately reflect our market as a whole. We see this in the slight decrease in the average sales price, while the median remains relatively stable because it removes the outliers. This is a good reminder to look at both metrics together.
Time on the Market:
- Average Days on Market: 130 days
- February 2026: 134 - 🠇 4 days
- March 2025: 115 - 🠅 15 days
- Median Days on Market: 107 days
- February 2026: 110 - 🠇 3 days
- March 2025: 92 - 🠅 15 days
These slight MoM decreases hint that the market is beginning to pick up in pace. However, days on market are 15 days higher YoY, which is tied to the growing inventory and more choices for buyers. We are seeing more price reductions and homes staying on the market for longer, making accurate, fair market pricing more important than ever.
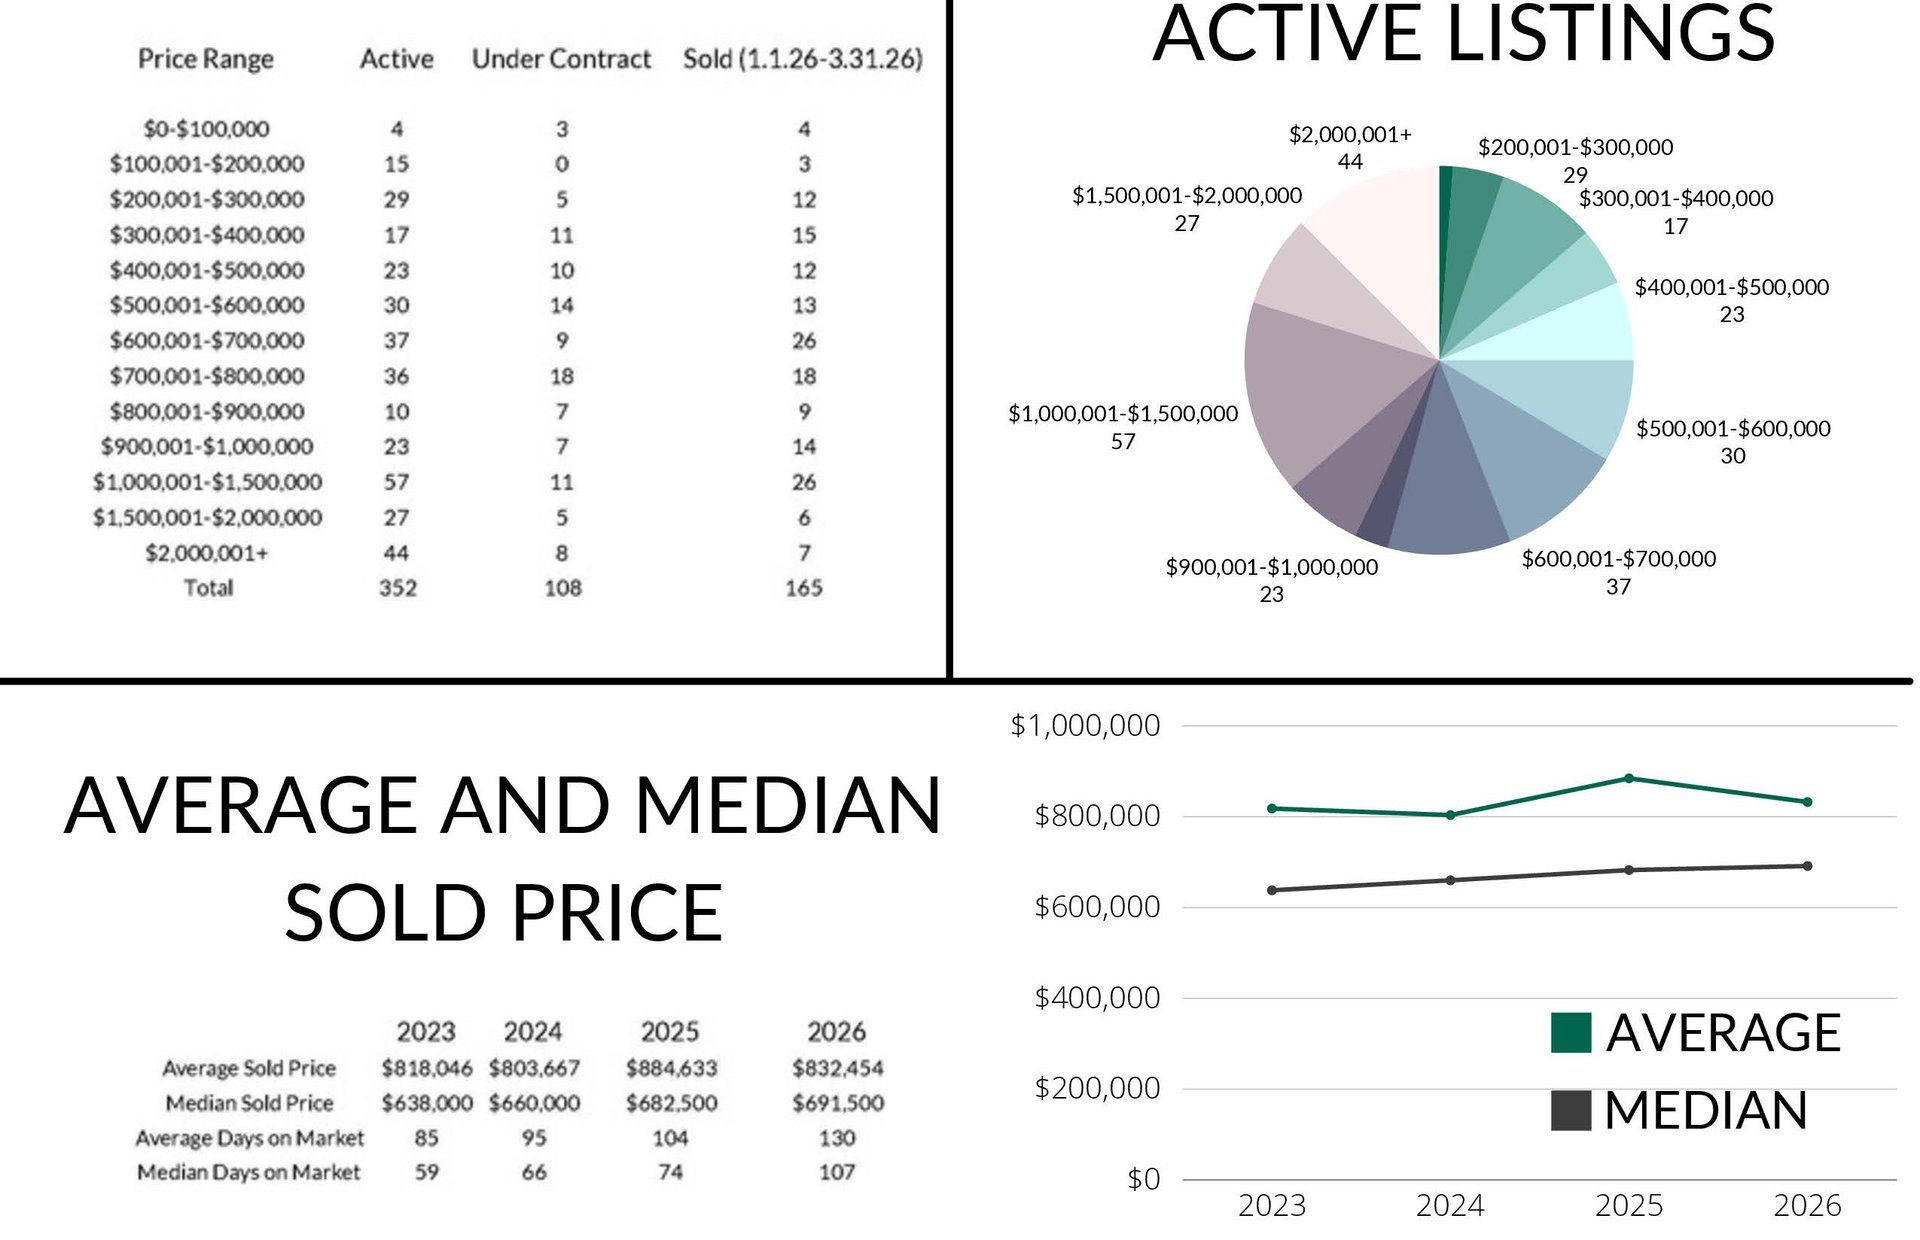
Trending Price Ranges:
- $200,001 - $300,000
- 29 active listings
- $500,001 - $800,000
- 103 active listings
- 41 pending
- 57 sold year-to-date
- $1,000,000+
- 57 active listings between $1,000,001 - $1,500,000
- 27 active listings between $1,500,001 - $2,000,000
- 44 active listings over $2,000,001
- 39 $1,000,000+ listings sold year-to-date
Resort-area condos and mobile homes that are not attached to the land make up the listings under $300,000. We’ve seen an active mid-range market, with just about 30% of the active and sold listings in the $500,001 - $800,000 range, supporting the median sales price data.
As the weather and the market continue to heat up, we look forward to enjoying summer activities alongside a busy real estate season in Southwest Colorado. If you’re buying, selling, or just have questions about the market, we are always here to help. Please contact The Durango Team at The Wells Group for more information.