As we step into the final quarter of 2025, the La Plata County residential real estate market is showing a familiar seasonal shift - activity remains healthy overall, but momentum is beginning to cool as we approach winter. The latest numbers give us valuable insight into inventory trends, sales patterns, and price movement compared to recent months and years.
October Sales:
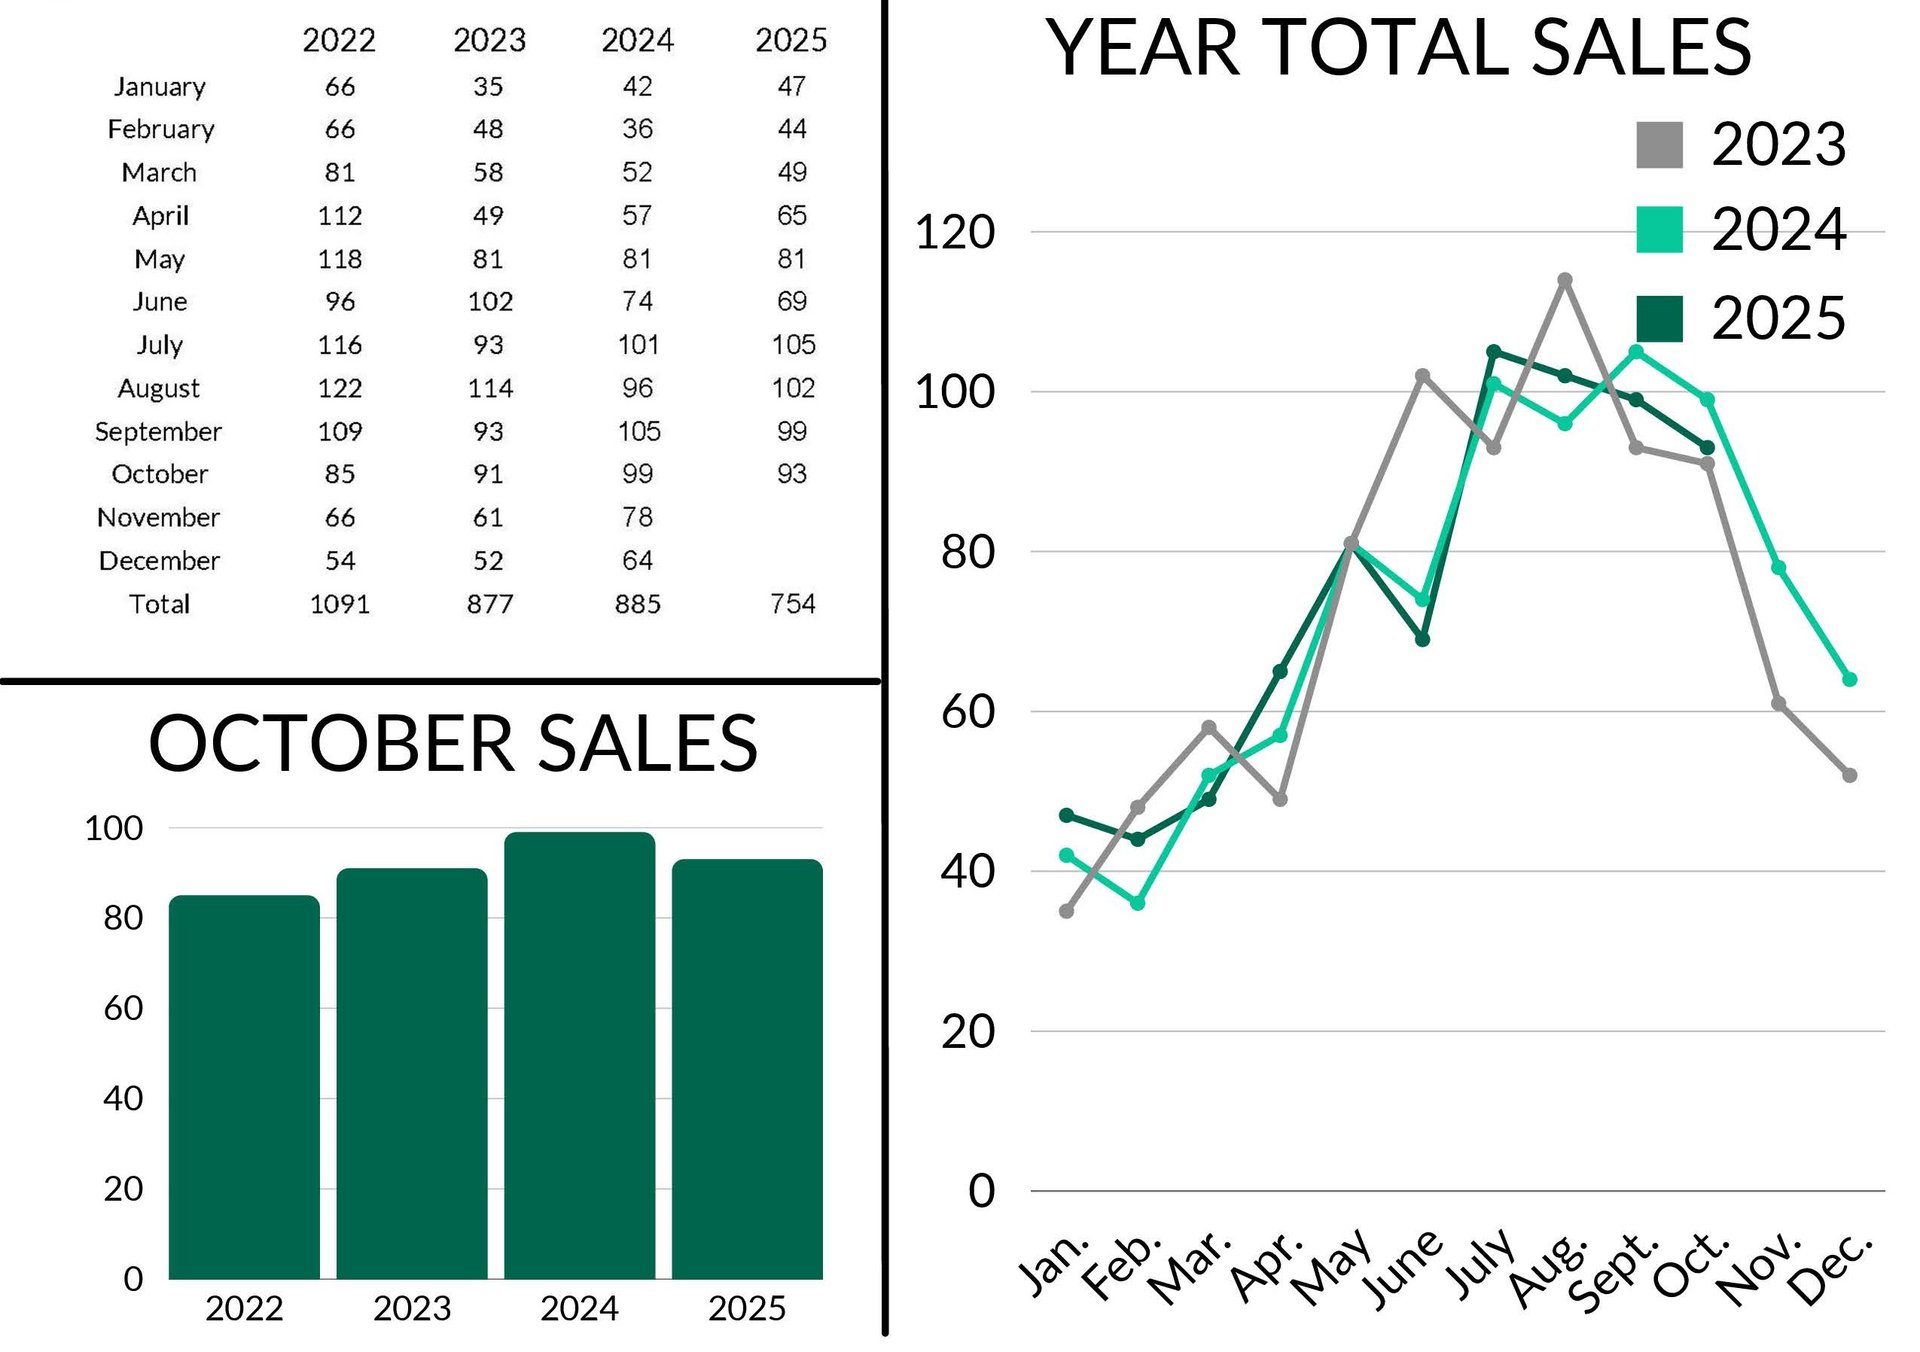
- October 2025 Total: 93
- September 2025: 99 - down 6.45%
- October 2024: 99 - down 6.45%
- Year-to-date (YTD) sales: 754
- 2024: 743 - up 1.48%
- 2023: 764 - down 1.33%
It’s uncommon for the month-over-month (MoM) and year-over-year (YoY) changes to be identical, but that’s exactly what we saw in October. Even so, 93 sales is a solid number for this time of year. Year-to-date, 2025 remains slightly ahead of last year, and just a bit below 2023.
Inventory:
- Active Listings: 385
- September 2025: 434 - down 12.73%
- October 2024: 345 - up 11.59%
- Pending (under contract) Listings: 101
- September 2025: 119 - down 17.82%
- October 2024: 108 - down 6.93%
We typically see inventory decrease in Q4; homes continue to close from fall activity, but fewer new listings come on the market or are pulled off the market heading into the winter season. We are pleased to see that active inventory remains higher YoY; this is a positive sign for buyer choice and long-term balance. Pending listings dipped both MoM and YoY, reflecting the seasonal slowdown.
Price Trends:
- Average Sales Price: $884,275
- September 2025: $862,440 - up 2.53%
- October 2024: $792,565 - up 11.57%
- Median Sales Price: $686,500
- September 2025: $670,950 - up 2.32%
- October 2024: $650,000 - up 5.62%
Year over year appreciation remains strong for both the average and median prices, showing continued demand and buyer confidence. Overall 2025 has been a recalibration year for our real estate market and we anticipate seeing more stability and consistency in our annual appreciation rates moving forward.
Time on the Market:
- Average Days on Market: 99 days
- 3 days longer month-over-month
- 8 days longer year-over-year
- Median Days on Market: 70 days
- The same month-over-month
- 7 days longer year-over-year
Over the last few months, days on market have leveled out. The typical timeframe from under contract to closing is 30-45 days and of course, some homes may go under immediately while others take longer to find the right buyer. Higher inventory is giving buyers more room to compare options and choose the right home, which contributes to slightly longer time on market.
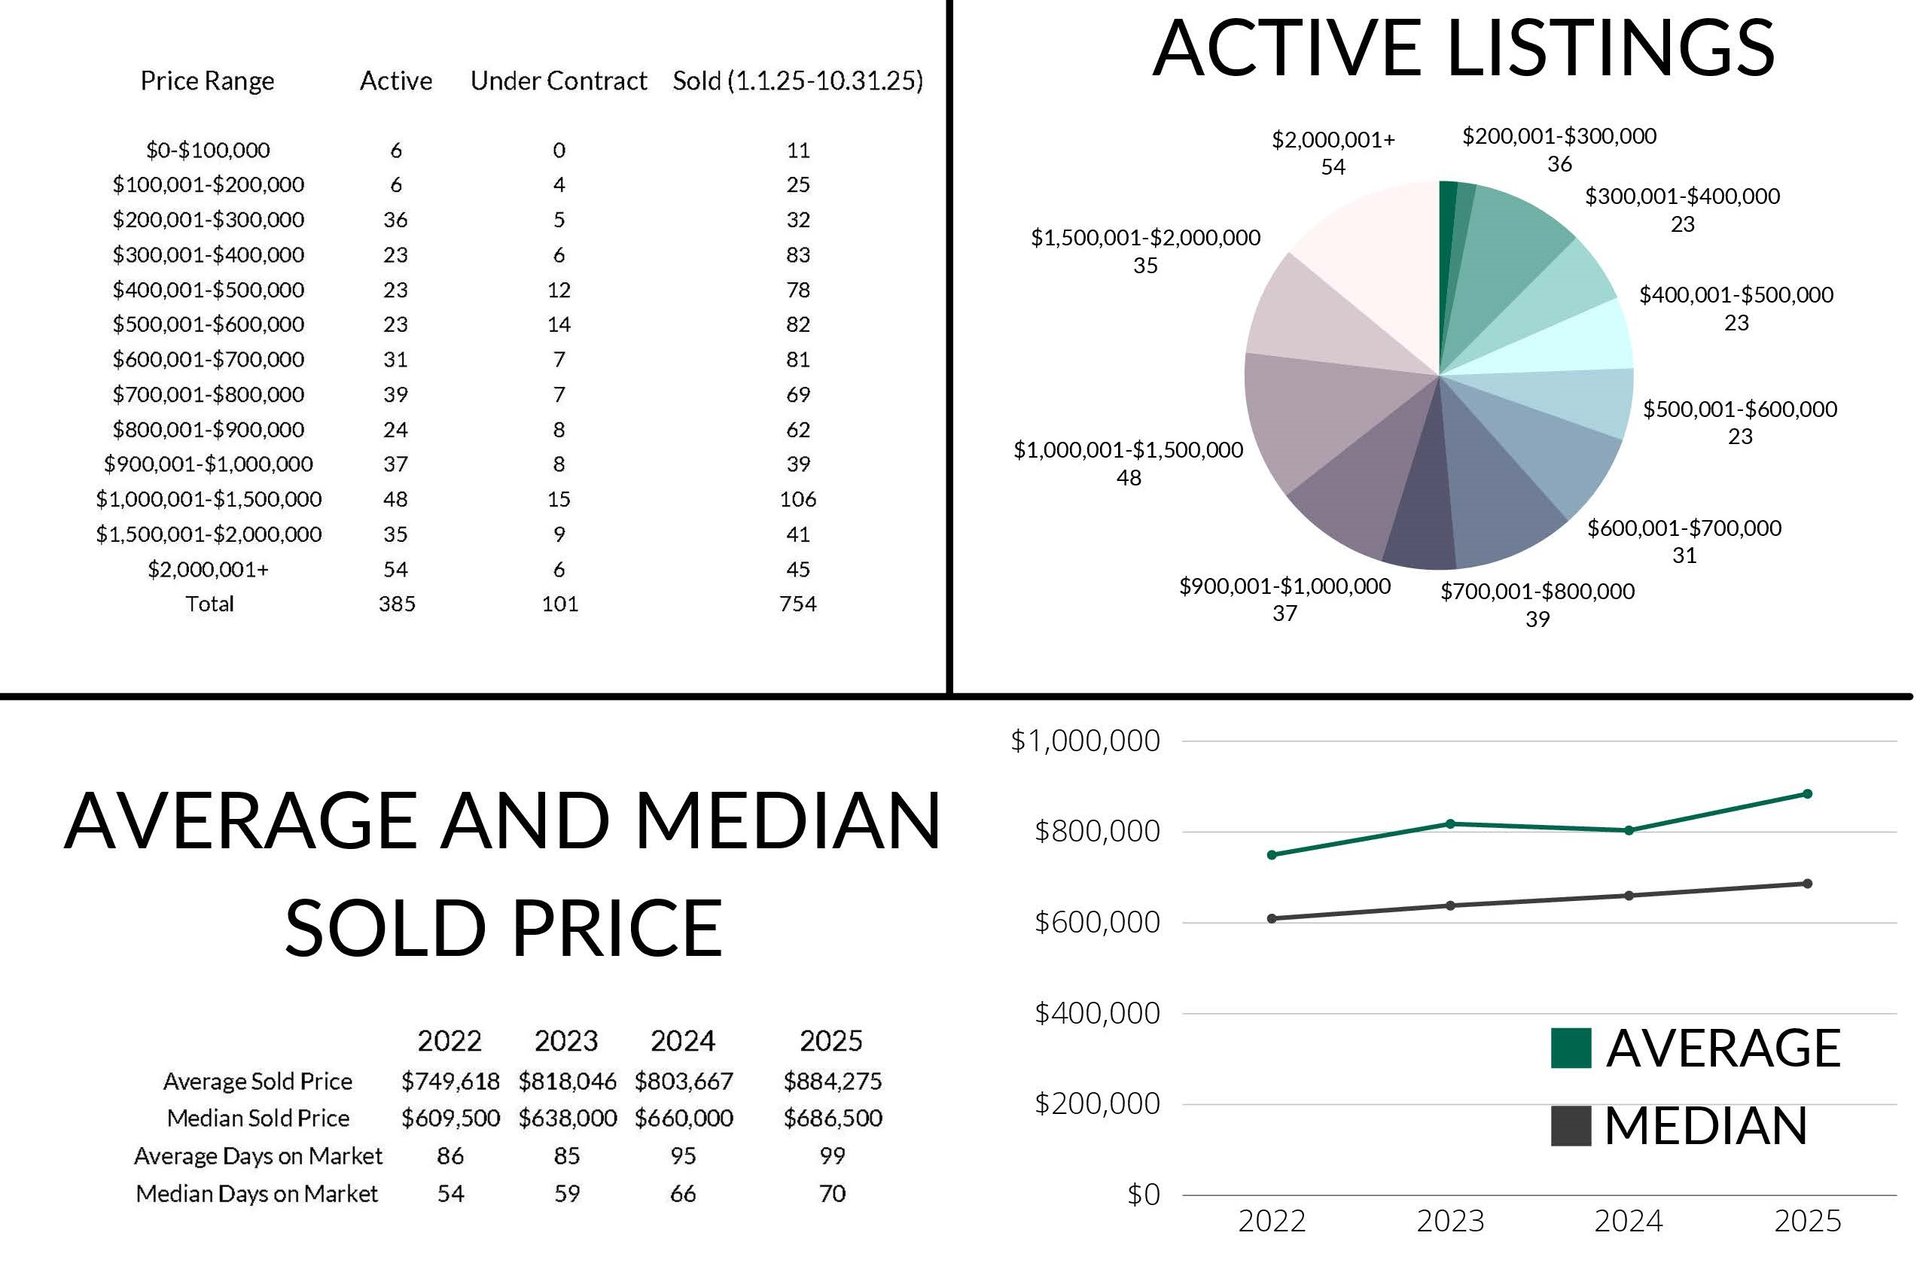
Trending Price Ranges:
- $1,000,000+
- 48 active listings between $1,000,001 - $1,500,000
- 35 active listings between $1,500,001 - $2,000,000
- 54 active listings $2,000,001+
- 106 sold listings between $1,000,001 - $1,500,000
- $300,001 - $400,000
- 83 sold listings
- $300,001 - $400,000; $400,001 - $500,000; $500,0001 - $600,000
- 23 active listings in each category
Looking at all 754 sales in 2025, over 25% sold for over $1,000,001 and more than 35% of active listings and 30% of pending listings sit in this price range. Meanwhile, about 60% of sales fall between $300,001 - $900,000, which helps anchor both the median and average sales prices.
While October experienced a modest yet expected slowdown, year-to-date numbers remain on track with predictions and continue to show signs of a more balanced environment for both buyers and sellers. As we move into the winter and holiday seasons, activity traditionally tapers, but we are always available to answer your questions and support you in your buying or selling journey.