Beginning the final quarter of 2026, the La Plata County residential market has stayed steady. The recent flooding has been impactful in so many ways to our community with lots of unknowns still ahead of us. However, through tracking data month-over-month (MoM) and year-over-year (YoY), we are able to see the effects and patterns. Before we can see any changes recent events have potentially caused, we look back on the October market.
October Sales:
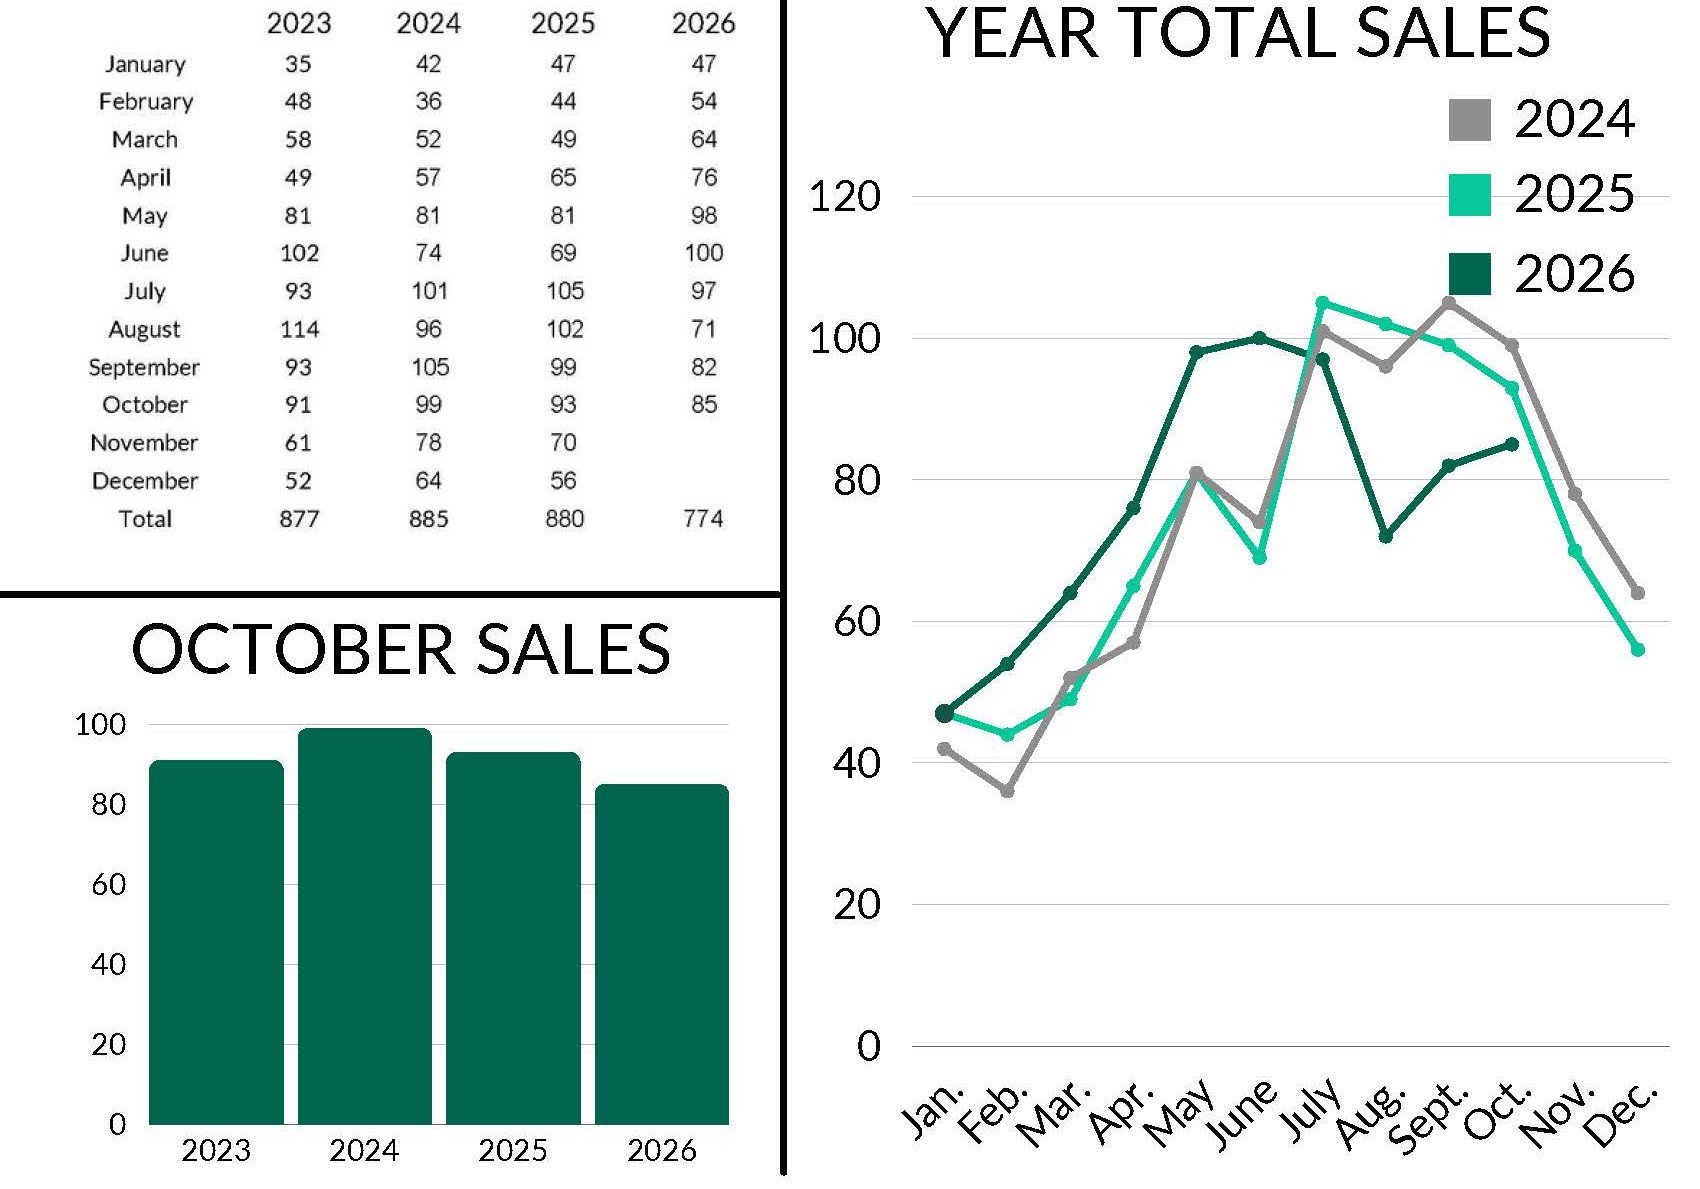
October 2026 Total Sales: 85
September 2026: 82 - 🠅 3.66%
October 2025: 93 - 🠇 8.6%
Year-to-date Sales: 774
2025: 754 - 🠅 2.65%
2024: 743 - 🠅 4.17%
While the market typically starts to cool down in October alongside the weather, this year has seen a slightly different trajectory. With decreased August and September sales, a new trend that can be attributed to 7%+ mortgage rates, October increased slightly. Despite October sales decreasing YoY, year-to-date (YTD) there have been 20 more 2026 total sales than 2025. Compared to 2024, over 30 more sales have occurred because the inventory has regrown and has been available this year. The rest of the 2026 market has potential to continue this activity and we look forward to seeing the greater Durango area rebuild stronger.
Inventory:
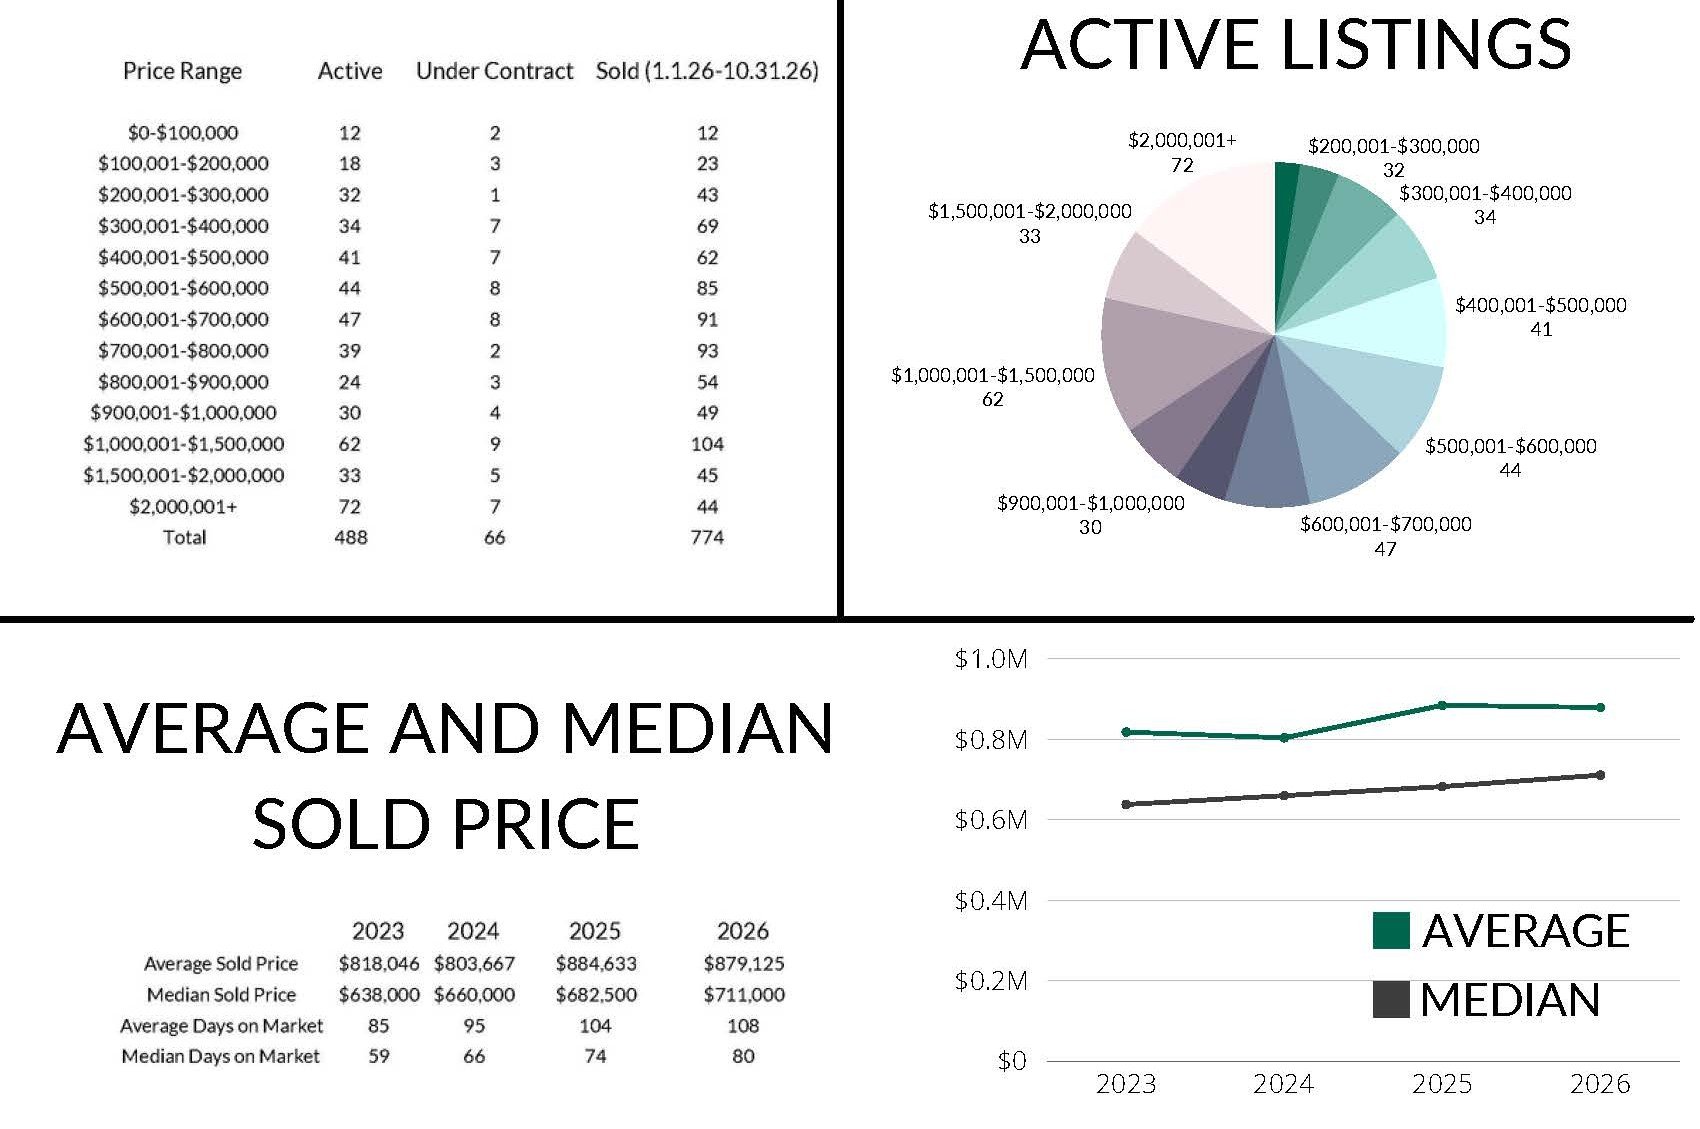
Active Listings: 488
September 2026: 550 - 🠇 11.27%
October 2025: 385 - 🠅 26.75%
Pending (under contract) Listings: 66
September 2026: 104 - 🠇 36.54%
October 2025: 101 - 🠇 34.65%
As per usual, the inventory also tends to decrease going into the winter months. It’s important to see that YoY, that there are over 100 more listings. This continued trend has balanced out the market more. The decrease MoM and YoY in pending listings may be partially affected by recent events, and we will see where the next few months lead to.
Price Trends:
Average Sales Price: $879,125
September 2026: $887,781 - 🠇 0.98%
October 2025: $884,275 - 🠇 0.58%
Median Sales Price: $711,000
September 2026: $725,000 - 🠇 1.93%
October 2025: $686,500 - 🠅 3.57%
While the average sales price has stayed nearly consistent MoM and YoY, the median sales price has dropped slightly MoM while retaining a healthy 3.5% annual appreciation. The average is greatly affected by multi-million dollar and lower-priced modulars and condos; however, the median more accurately reflects the market as a whole. Especially with elevated mortgage rates, we’ve seen a significant number of price reductions for La Plata County homes. As the market is affected by local and outside market factors, understanding these changes and accurately pricing property is of the utmost importance.
Time on the Market:
Average Days on Market: 108 days
September 2026: 107 - 🠅 1 day
October 2025: 99 - 🠅 9 days
Median Days on Market: 80 days
September 2026: 76 - 🠅 4 days
October 2025: 70 - 🠅 10 days
Although the average days on market have stayed almost identical over the last few months, it has increased over a week YoY. Similarly with the median, we can see a small slow down MoM and a little more YoY. It is expected for the market to slow and with the added factors, it’s unsurprising to see the trend appear. However, La Plata County homes continue to be in high demand and we know that they will continue to sell with proper pricing.
Trending Price Ranges:
$400,001 - $700,000
132 active listings
23 pending
238 sold YTD
$700,001 - $800,000
39 active listings
2 pending
93 sold YTD
$1,000,000+
62 active listings between $1,000,001 - $1,500,000
33 active listings between $1,500,001 - $2,000,000
72 active listings over $2,000,001
21 $1,000,000+ pending listings
193 $1,000,000+ listings sold year-to-date
There were no sub $100,000 sales in October and just 8 under $300,000. We saw 32 sales between $400,001 - $700,000 and six in the $700,001 - $800,000 range, the most popular sold category under $1m. The $1,000,001+ categories also continue to grow; they account for 34% of active listings, 32% of pending, and 25% of sold. With the market slowing and mortgage rates still above 7%, we see decreases in pendings in nearly every price category. In the past, fall has shown continued movement, particularly in some sectors of the market such as luxury which is less affected by interest rates as there is a higher number of cash buyers.
Nearing the holiday season, we know life can get busy. We hope that the last two months of the year are prosperous and that all stay safe. As always, we are available for information on buying or selling in the Durango and greater Southwest Colorado real estate market. Please don’t hesitate to contact The Durango Team at The Wells Group.