Analyzing market trends month-over-month (MoM) and year-over-year (YoY) provides insight and helps us support our clients as we move forward in 2026. The health of the La Plata County residential market is best represented by inventory levels, sales activity, median prices, and days on market.
February Sales:
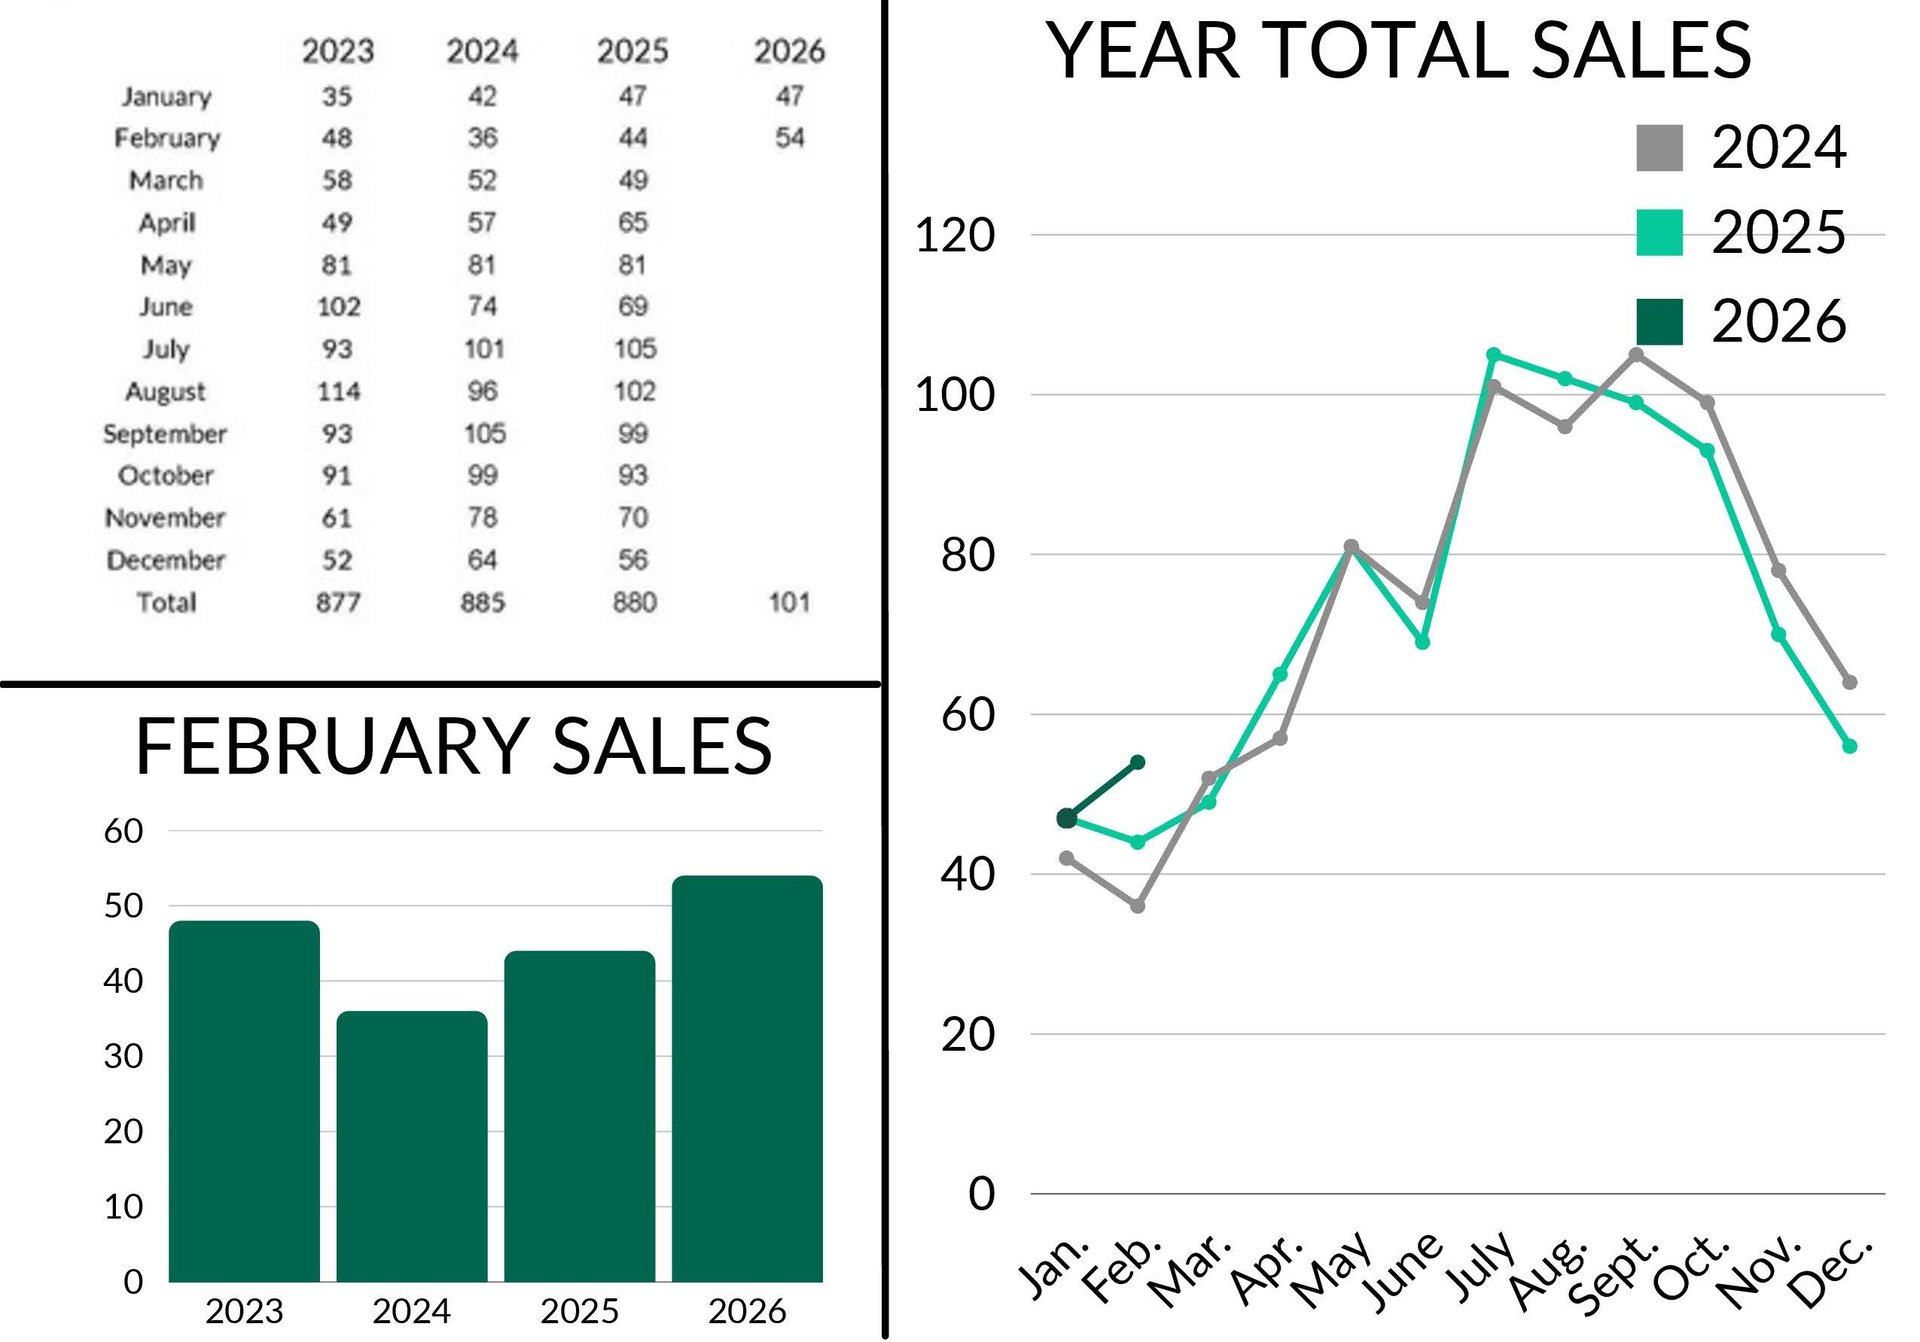
- February 2026 Total Sales: 54
- January 2026: 47 - 🠅 14.89%
- February 2025: 44 - 🠅 22.73%
We are pleased to see an increase in sales from last February and attribute this growth to a combination of a warmer winter season and increased inventory YoY. We expect this trend to continue moving into summer.
Inventory:
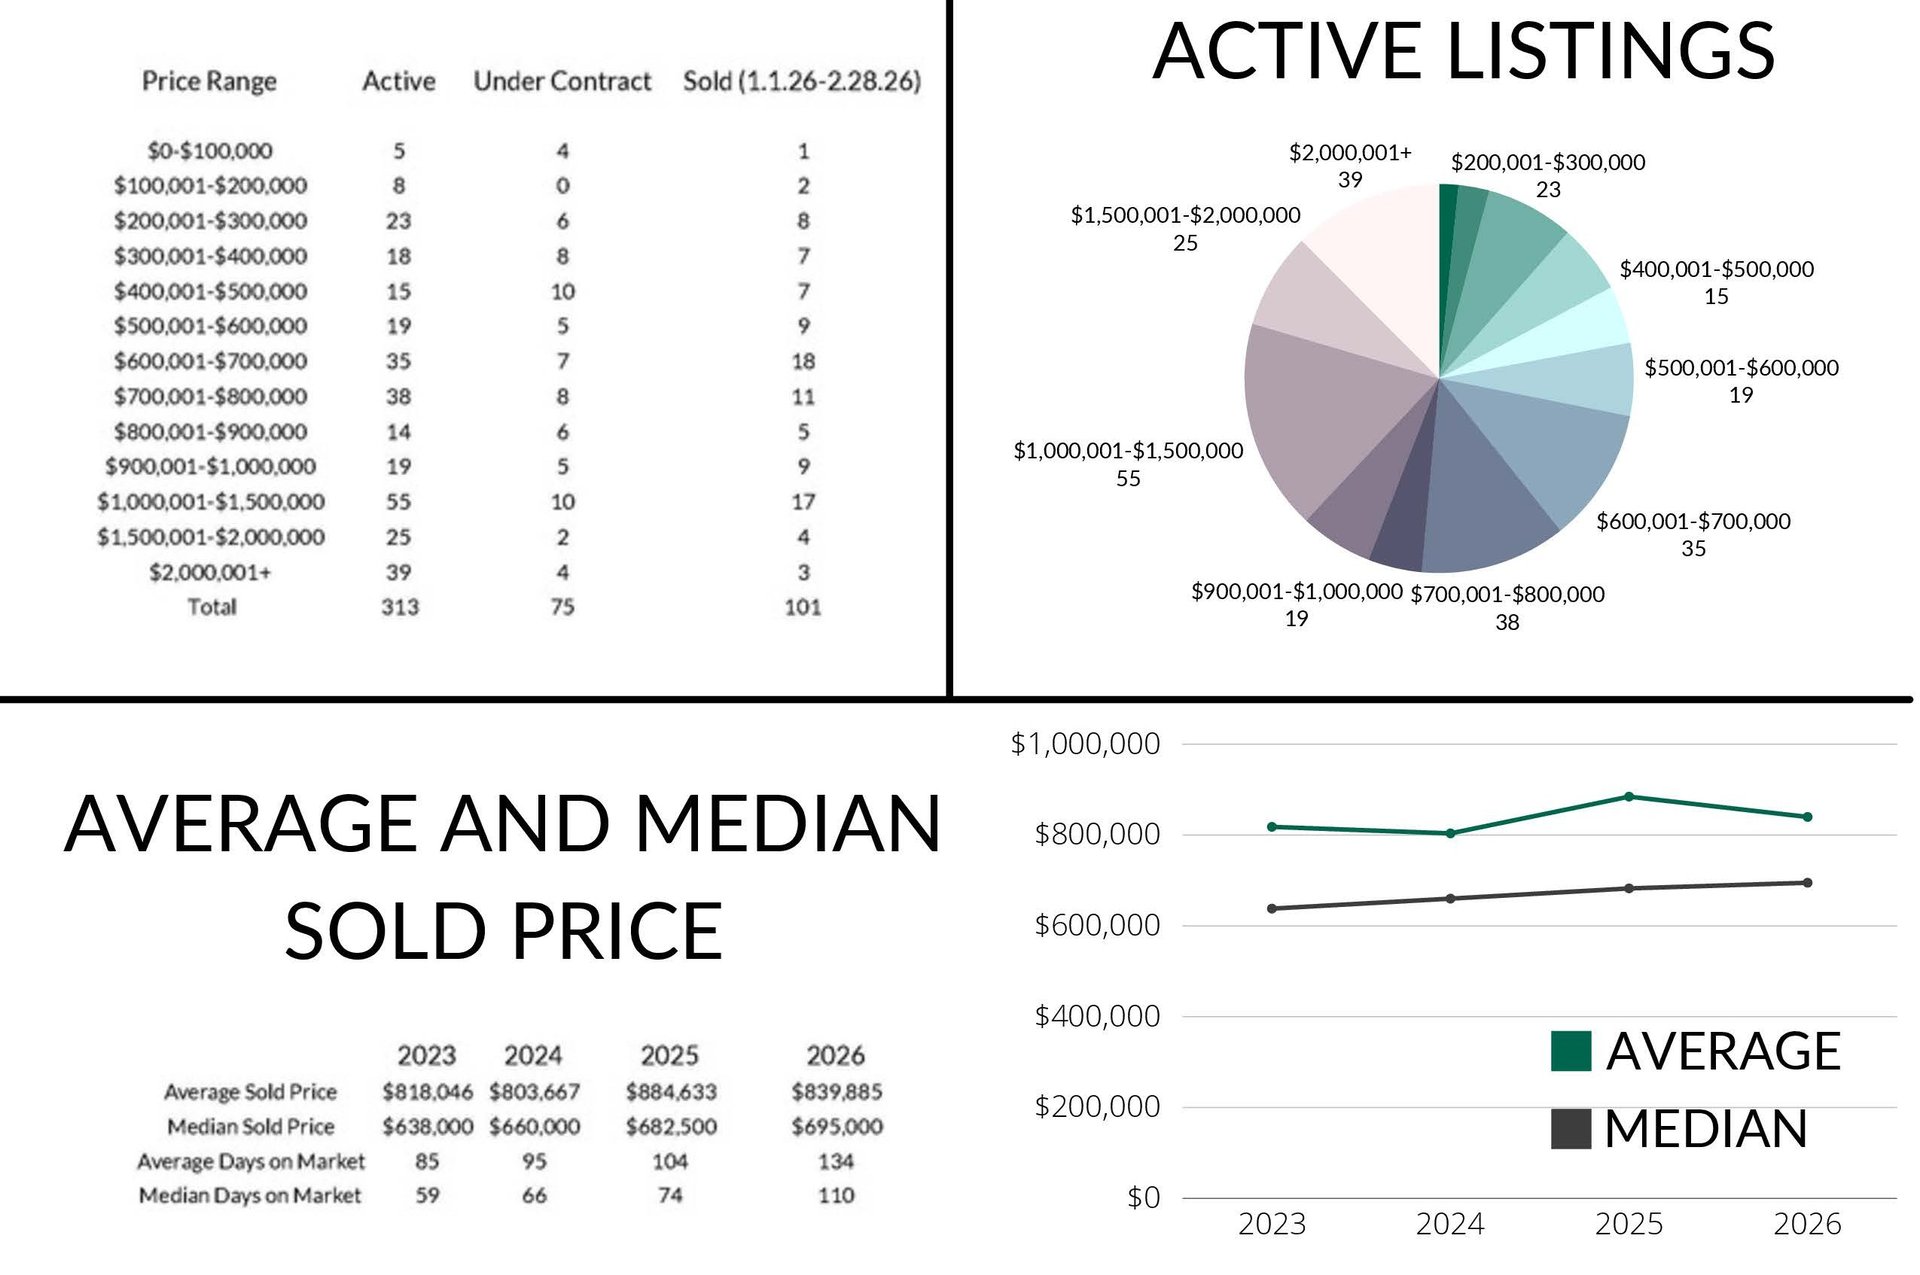
- Active Listings: 313
- January 2026: 284 - 🠅 10.21%
- February 2025: 251 - 🠅 24.7%
- Pending (under contract) Listings: 75
- January 2026: 88 - 🠇 17.33%
- February 2025: 72 - 🠅 4.17%
Inventory is up both MoM and YoY, which is healthy for our market. This 10% MoM increase shows strong early-season momentum, especially considering inventory did not hit the 300s until April last year. Overall inventory is still rebuilding from 2020-2022, and this nearly 25% YoY increase represents meaningful progress.
Price Trends:
- Average Sales Price: $839,885
- January 2026: $763,231 - 🠅 10.04%
- February 2025: $756,068 - 🠅 11.09%
- Median Sales Price: $695,000
- January 2026: $695,500 - 🠇 0.07%
- February 2025: $585,000 - 🠅 18.8%
As we mentioned in our January stats blog last month, the average and median sales prices are calculated using year-to-date totals, and a high percentage of luxury sales can influence these numbers. With a total of 101 sales so far this year, 24 have sold for over $1,000,000, which particularly impacts the average price. For a more accurate picture, it’s important to look at where 2025 ended compared to where 2026 began. In December 2025, the average sales price was $884,633 and the median was $682,500. Based on those figures, February’s average sales price has actually decreased, largely due to several high-end sales that occurred in December, but the median sales price has only increased by 1.83%, which represents healthy growth for this time of year. As 2026 progresses, we expect both indicators to better reflect overall market conditions across our area.
Time on the Market:
- Average Days on Market: 134 days
- January 2026: 127 - 🠅 7 days
- February 2025: 116 - 🠅 18 days
- Median Days on Market: 110 days
- January 2026: 101 - 🠅 9 days
- February 2025: 99 - 🠅 11 days
The trend we noted last month continues: both average and median days on market have increased YoY and MoM. This aligns with the decline in pending listings, suggesting some homes are taking longer to sell and that we are seeing more price reductions.
Trending Price Ranges:
- $200,001 - $300,000
- 23 active listings
- 11 sold year-to-date
- $600,001 - $800,000
- 73 active listings
- 29 sold year-to-date
- $1,000,000+
- 55 active listings between $1,000,001 - $1,500,000
- 25 active listings between $1,500,001 - $2,000,000
- 39 active listings over $2,000,001
- 24 $1,000,000+ listings sold year-to-date
The large number of listings under $300,000 consists primarily of resort-area condos and manufactured units located in mobile home parks that are not attached to the land. We’d love to see the $300,000 - $600,000 range grow in La Plata County for our locals and first-time home buyers. The $1,000,000+ market accounts for over one-third of active listings, and sales have doubled since January, which supports the heightened median and average sales price. The highest sold price increased from $1,700,000 in January to $4,200,000.
We look forward to the upcoming months as the market gains momentum during the spring and summer seasons. Whether you’re buying, selling, or simply keeping an eye on the market, we are always happy to help you navigate the La Plata County real estate landscape. For more information on specific real estate sectors or areas, please contact The Durango Team at The Wells Group, Durango’s best real estate brokerage.